Learn what to expect in the new updates


(Source code, png, hires.png, pdf)
"""
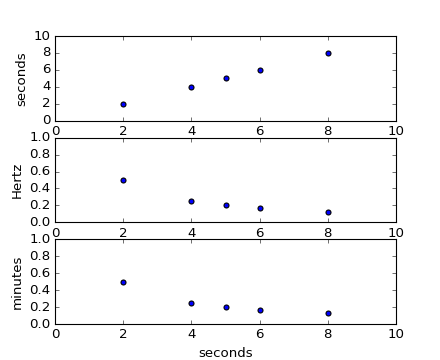
Demonstrate unit handling
basic_units is a mockup of a true units package used for testing
purposed, which illustrates the basic interface that a units package
must provide to matplotlib.
The example below shows support for unit conversions over masked
arrays.
"""
import numpy as np
from basic_units import secs, hertz, minutes
from matplotlib.pylab import figure, show
# create masked array
xsecs = secs*np.ma.MaskedArray((1, 2, 3, 4, 5, 6, 7, 8), (1, 0, 1, 0, 0, 0, 1, 0), np.float)
#xsecs = secs*np.arange(1,10.)
fig = figure()
ax1 = fig.add_subplot(3, 1, 1)
ax1.scatter(xsecs, xsecs)
#ax1.set_ylabel('seconds')
ax1.axis([0, 10, 0, 10])
ax2 = fig.add_subplot(3, 1, 2, sharex=ax1)
ax2.scatter(xsecs, xsecs, yunits=hertz)
ax2.axis([0, 10, 0, 1])
ax3 = fig.add_subplot(3, 1, 3, sharex=ax1)
ax3.scatter(xsecs, xsecs, yunits=hertz)
ax3.yaxis.set_units(minutes)
ax3.axis([0, 10, 0, 1])
show()
Keywords: python, matplotlib, pylab, example, codex (see Search examples)