Learn what to expect in the new updates


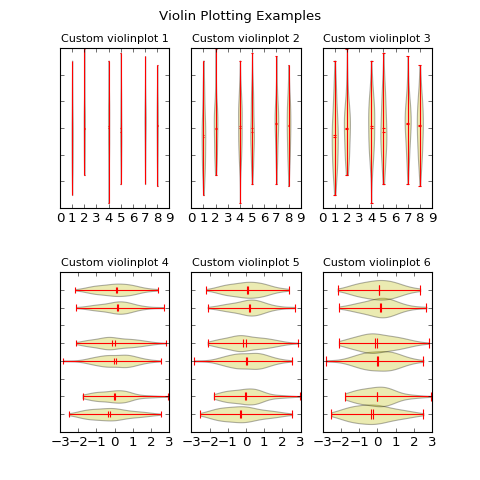
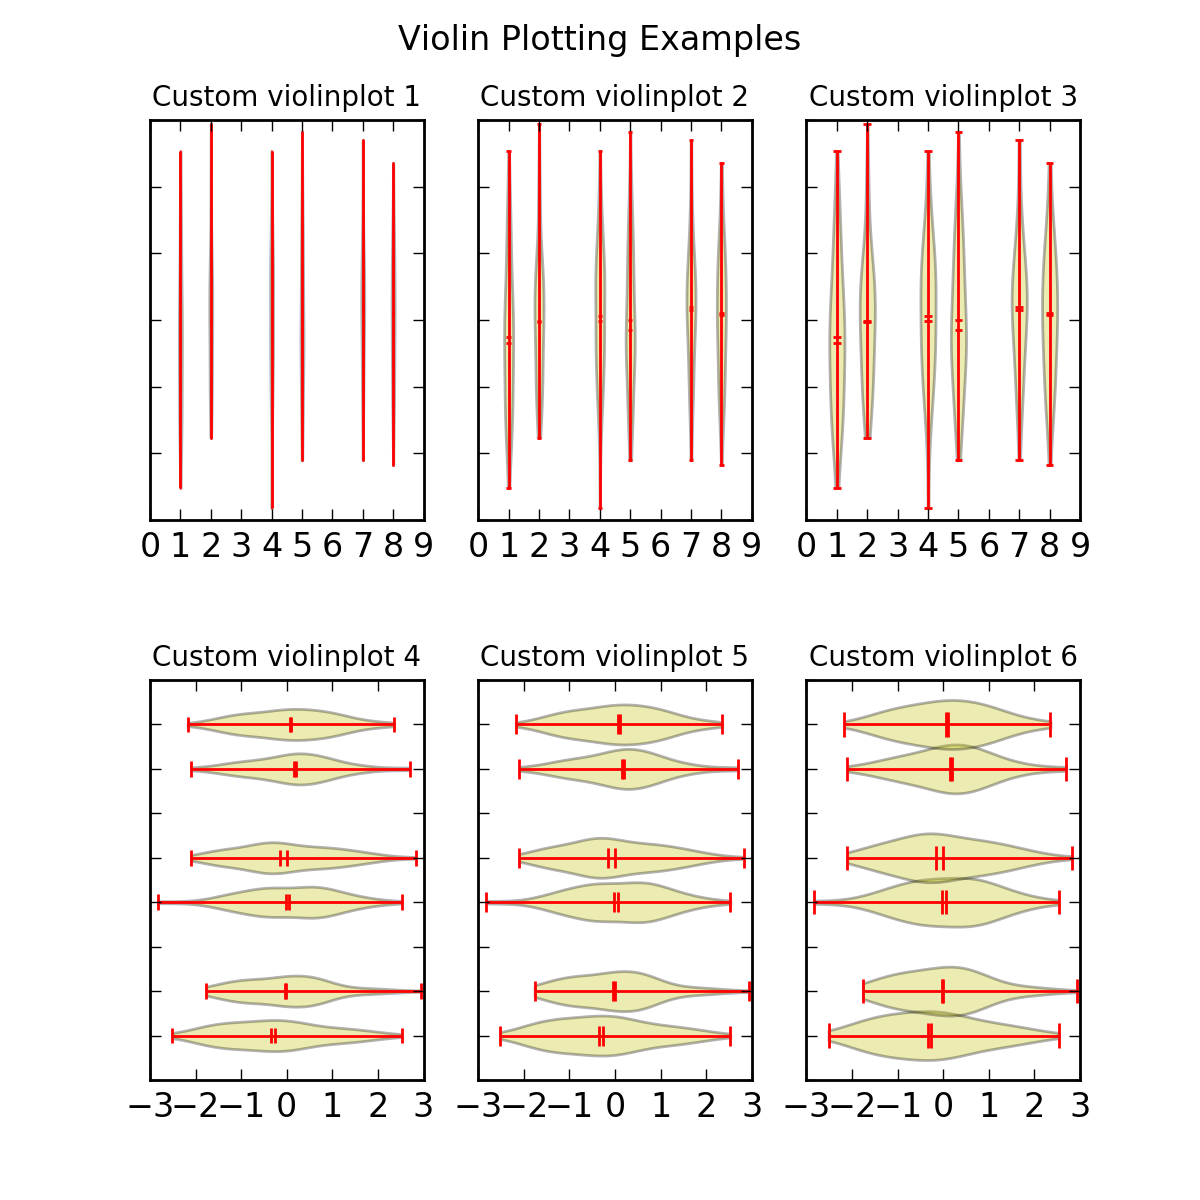
(Source code, png, hires.png, pdf)

"""
Demo of the new violinplot functionality
"""

import random
import numpy as np
import matplotlib.pyplot as plt

# fake data
fs = 10  # fontsize
pos = [1, 2, 4, 5, 7, 8]
data = [np.random.normal(size=100) for i in pos]

fig, axes = plt.subplots(nrows=2, ncols=3, figsize=(6, 6))

axes[0, 0].violinplot(data, pos, points=20, widths=0.1,
                      showmeans=True, showextrema=True, showmedians=True)
axes[0, 0].set_title('Custom violinplot 1', fontsize=fs)

axes[0, 1].violinplot(data, pos, points=40, widths=0.3,
                      showmeans=True, showextrema=True, showmedians=True,
                      bw_method='silverman')
axes[0, 1].set_title('Custom violinplot 2', fontsize=fs)

axes[0, 2].violinplot(data, pos, points=60, widths=0.5, showmeans=True,
                      showextrema=True, showmedians=True, bw_method=0.5)
axes[0, 2].set_title('Custom violinplot 3', fontsize=fs)

axes[1, 0].violinplot(data, pos, points=80, vert=False, widths=0.7,
                      showmeans=True, showextrema=True, showmedians=True)
axes[1, 0].set_title('Custom violinplot 4', fontsize=fs)

axes[1, 1].violinplot(data, pos, points=100, vert=False, widths=0.9,
                      showmeans=True, showextrema=True, showmedians=True,
                      bw_method='silverman')
axes[1, 1].set_title('Custom violinplot 5', fontsize=fs)

axes[1, 2].violinplot(data, pos, points=200, vert=False, widths=1.1,
                      showmeans=True, showextrema=True, showmedians=True,
                      bw_method=0.5)
axes[1, 2].set_title('Custom violinplot 6', fontsize=fs)

for ax in axes.flatten():
    ax.set_yticklabels([])

fig.suptitle("Violin Plotting Examples")
fig.subplots_adjust(hspace=0.4)
plt.show()
Keywords: python, matplotlib, pylab, example, codex (see Search examples)