Learn what to expect in the new updates


(Source code, png, hires.png, pdf)

"""
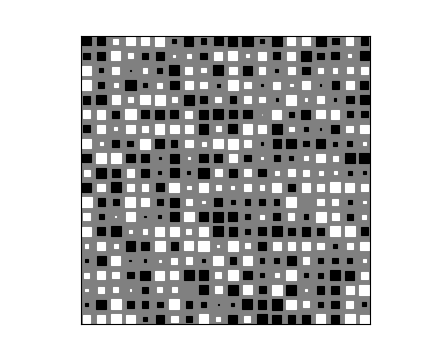
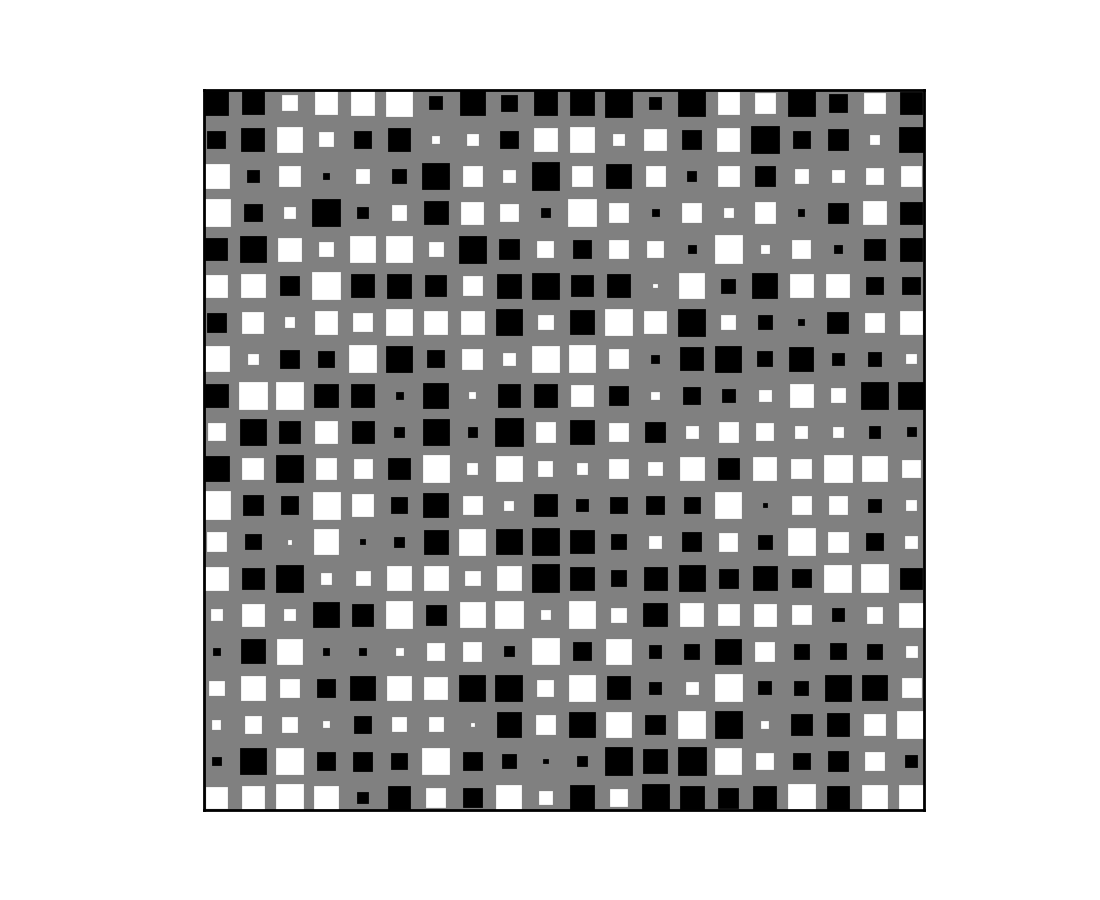
Demo of a function to create Hinton diagrams.
Hinton diagrams are useful for visualizing the values of a 2D array (e.g.
a weight matrix): Positive and negative values are represented by white and
black squares, respectively, and the size of each square represents the
magnitude of each value.
Initial idea from David Warde-Farley on the SciPy Cookbook
"""
import numpy as np
import matplotlib.pyplot as plt
def hinton(matrix, max_weight=None, ax=None):
"""Draw Hinton diagram for visualizing a weight matrix."""
ax = ax if ax is not None else plt.gca()
if not max_weight:
max_weight = 2**np.ceil(np.log(np.abs(matrix).max())/np.log(2))
ax.patch.set_facecolor('gray')
ax.set_aspect('equal', 'box')
ax.xaxis.set_major_locator(plt.NullLocator())
ax.yaxis.set_major_locator(plt.NullLocator())
for (x, y), w in np.ndenumerate(matrix):
color = 'white' if w > 0 else 'black'
size = np.sqrt(np.abs(w))
rect = plt.Rectangle([x - size / 2, y - size / 2], size, size,
facecolor=color, edgecolor=color)
ax.add_patch(rect)
ax.autoscale_view()
ax.invert_yaxis()
if __name__ == '__main__':
hinton(np.random.rand(20, 20) - 0.5)
plt.show()
Keywords: python, matplotlib, pylab, example, codex (see Search examples)