Learn what to expect in the new updates


(Source code, png, hires.png, pdf)

"""
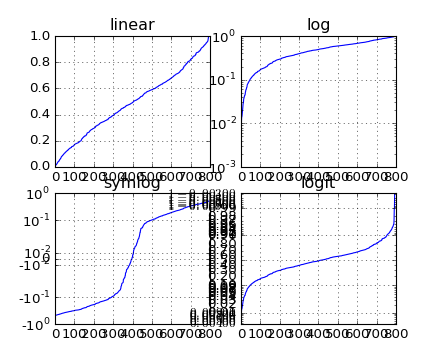
Illustrate the scale transformations applied to axes, e.g. log, symlog, logit.
"""
import numpy as np
import matplotlib.pyplot as plt
# make up some data in the interval ]0, 1[
y = np.random.normal(loc=0.5, scale=0.4, size=1000)
y = y[(y > 0) & (y < 1)]
y.sort()
x = np.arange(len(y))
# plot with various axes scales
fig, axs = plt.subplots(2, 2)
# linear
ax = axs[0, 0]
ax.plot(x, y)
ax.set_yscale('linear')
ax.set_title('linear')
ax.grid(True)
# log
ax = axs[0, 1]
ax.plot(x, y)
ax.set_yscale('log')
ax.set_title('log')
ax.grid(True)
# symmetric log
ax = axs[1, 0]
ax.plot(x, y - y.mean())
ax.set_yscale('symlog', linthreshy=0.05)
ax.set_title('symlog')
ax.grid(True)
# logit
ax = axs[1, 1]
ax.plot(x, y)
ax.set_yscale('logit')
ax.set_title('logit')
ax.grid(True)
plt.show()
Keywords: python, matplotlib, pylab, example, codex (see Search examples)