Learn what to expect in the new updates


(Source code, png, hires.png, pdf)

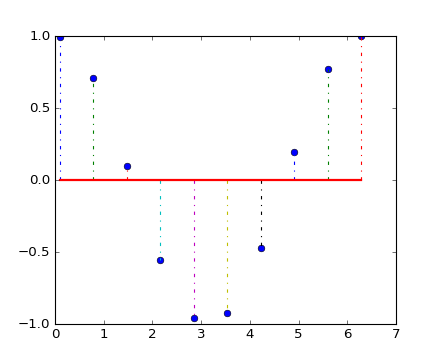
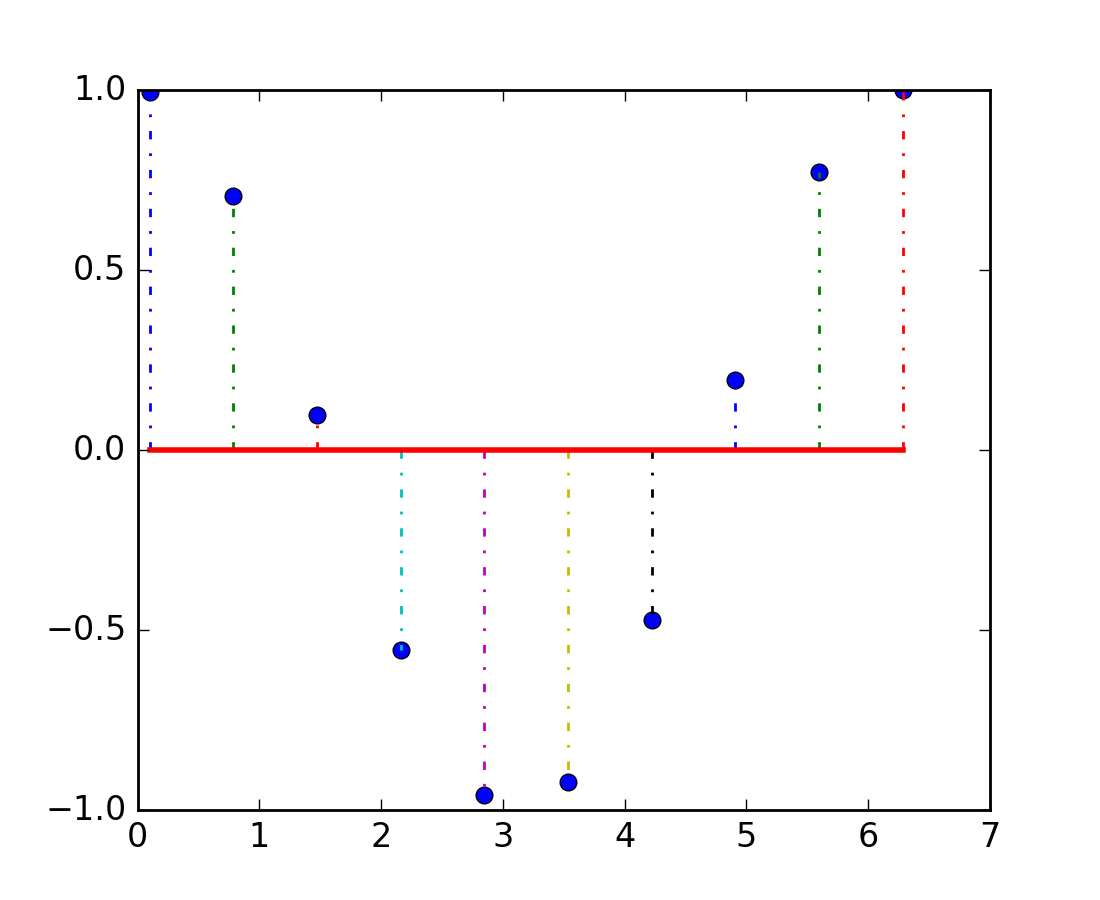
import matplotlib.pyplot as plt
import numpy as np

x = np.linspace(0.1, 2*np.pi, 10)
markerline, stemlines, baseline = plt.stem(x, np.cos(x), '-.')
plt.setp(markerline, 'markerfacecolor', 'b')
plt.setp(baseline, 'color', 'r', 'linewidth', 2)

plt.show()
Keywords: python, matplotlib, pylab, example, codex (see Search examples)