Learn what to expect in the new updates


(Source code, png, hires.png, pdf)
import numpy as np
import matplotlib.pyplot as plt
x = np.random.rand(10)
y = np.random.rand(10)
z = np.sqrt(x**2 + y**2)
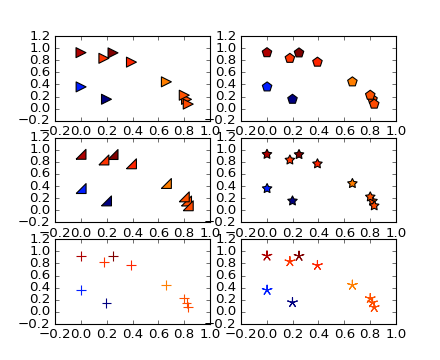
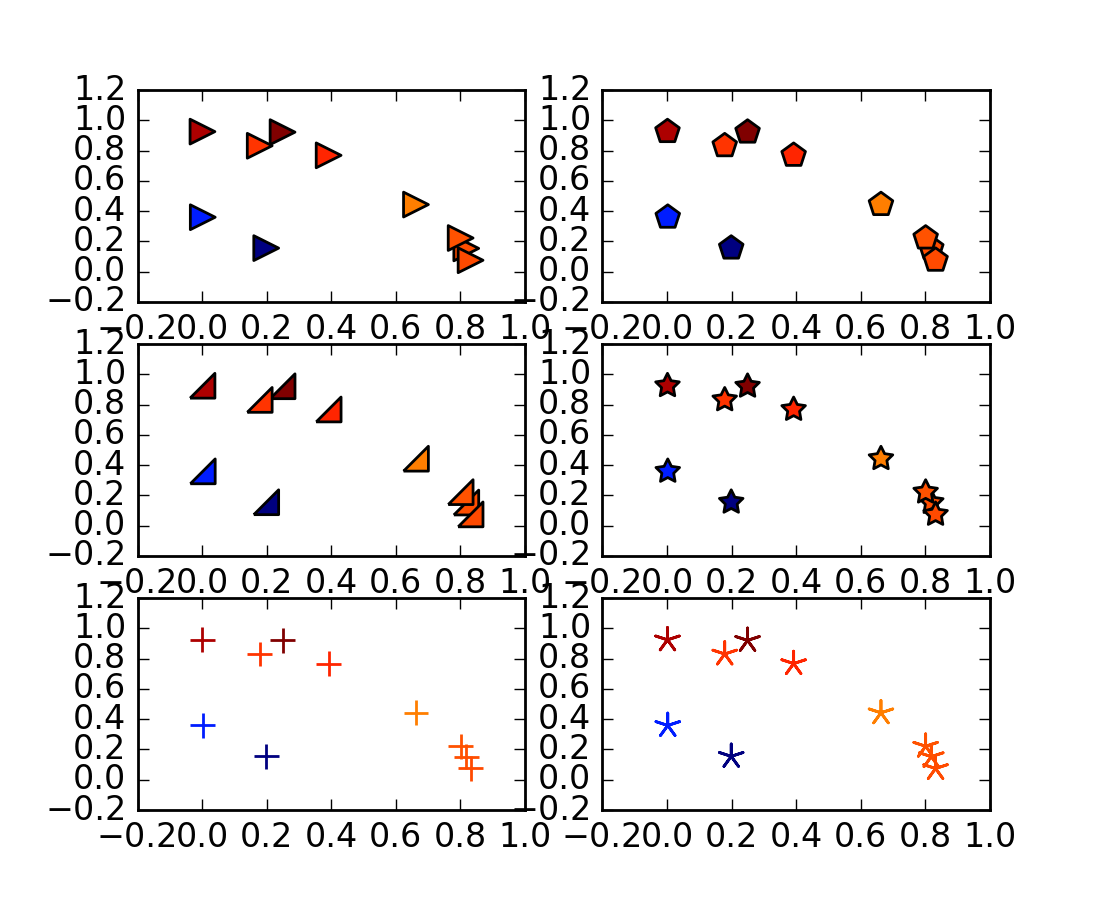
plt.subplot(321)
plt.scatter(x, y, s=80, c=z, marker=">")
plt.subplot(322)
plt.scatter(x, y, s=80, c=z, marker=(5, 0))
verts = list(zip([-1., 1., 1., -1.], [-1., -1., 1., -1.]))
plt.subplot(323)
plt.scatter(x, y, s=80, c=z, marker=(verts, 0))
# equivalent:
#plt.scatter(x,y,s=80, c=z, marker=None, verts=verts)
plt.subplot(324)
plt.scatter(x, y, s=80, c=z, marker=(5, 1))
plt.subplot(325)
plt.scatter(x, y, s=80, c=z, marker='+')
plt.subplot(326)
plt.scatter(x, y, s=80, c=z, marker=(5, 2))
plt.show()
Keywords: python, matplotlib, pylab, example, codex (see Search examples)