Learn what to expect in the new updates


(Source code, png, hires.png, pdf)

#!/usr/bin/env python
'''
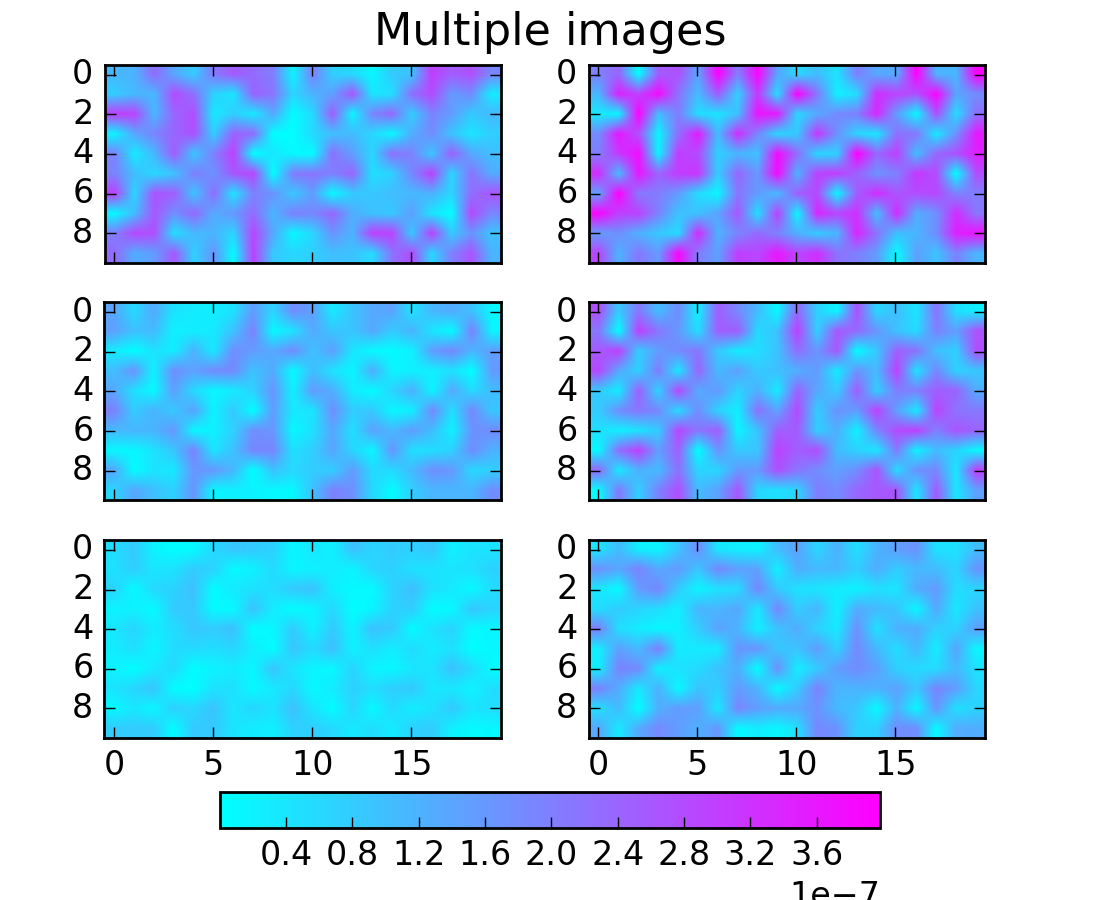
Make a set of images with a single colormap, norm, and colorbar.
It also illustrates colorbar tick labelling with a multiplier.
'''
from matplotlib.pyplot import figure, show, axes, sci
from matplotlib import cm, colors
from matplotlib.font_manager import FontProperties
from numpy import amin, amax, ravel
from numpy.random import rand
Nr = 3
Nc = 2
fig = figure()
cmap = cm.cool
figtitle = 'Multiple images'
t = fig.text(0.5, 0.95, figtitle,
horizontalalignment='center',
fontproperties=FontProperties(size=16))
cax = fig.add_axes([0.2, 0.08, 0.6, 0.04])
w = 0.4
h = 0.22
ax = []
images = []
vmin = 1e40
vmax = -1e40
for i in range(Nr):
for j in range(Nc):
pos = [0.075 + j*1.1*w, 0.18 + i*1.2*h, w, h]
a = fig.add_axes(pos)
if i > 0:
a.set_xticklabels([])
# Make some fake data with a range that varies
# somewhat from one plot to the next.
data = ((1 + i + j)/10.0)*rand(10, 20)*1e-6
dd = ravel(data)
# Manually find the min and max of all colors for
# use in setting the color scale.
vmin = min(vmin, amin(dd))
vmax = max(vmax, amax(dd))
images.append(a.imshow(data, cmap=cmap))
ax.append(a)
# Set the first image as the master, with all the others
# observing it for changes in cmap or norm.
class ImageFollower(object):
'update image in response to changes in clim or cmap on another image'
def __init__(self, follower):
self.follower = follower
def __call__(self, leader):
self.follower.set_cmap(leader.get_cmap())
self.follower.set_clim(leader.get_clim())
norm = colors.Normalize(vmin=vmin, vmax=vmax)
for i, im in enumerate(images):
im.set_norm(norm)
if i > 0:
images[0].callbacksSM.connect('changed', ImageFollower(im))
# The colorbar is also based on this master image.
fig.colorbar(images[0], cax, orientation='horizontal')
# We need the following only if we want to run this interactively and
# modify the colormap:
axes(ax[0]) # Return the current axes to the first one,
sci(images[0]) # because the current image must be in current axes.
show()
Keywords: python, matplotlib, pylab, example, codex (see Search examples)