Learn what to expect in the new updates


(Source code, png, hires.png, pdf)

import matplotlib.pyplot as plt
from matplotlib.collections import LineCollection
from matplotlib.colors import colorConverter
import numpy as np
# In order to efficiently plot many lines in a single set of axes,
# Matplotlib has the ability to add the lines all at once. Here is a
# simple example showing how it is done.
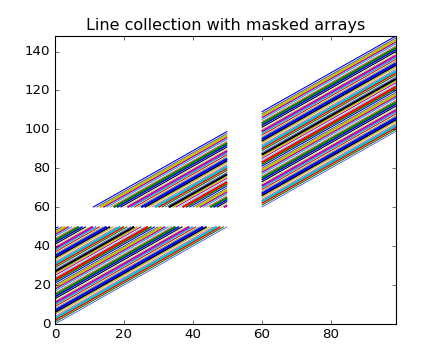
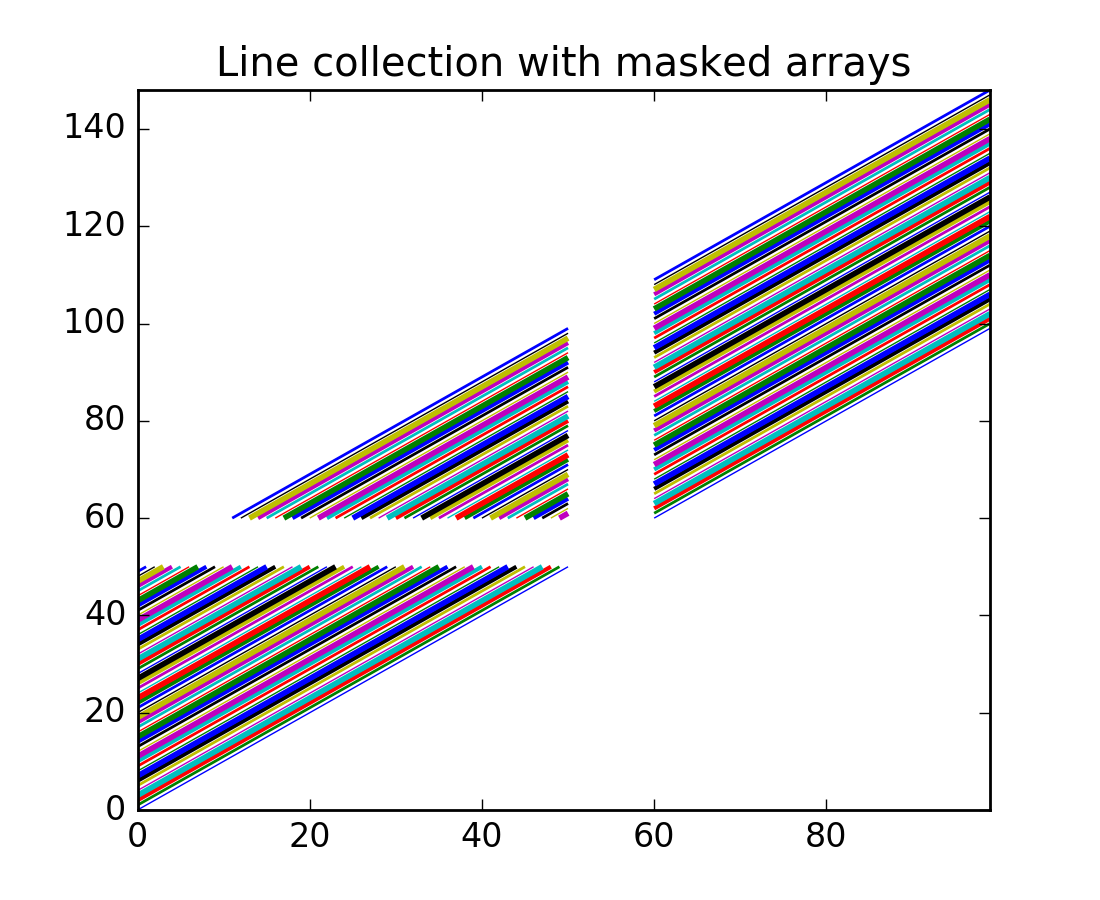
x = np.arange(100)
# Here are many sets of y to plot vs x
ys = x[:50, np.newaxis] + x[np.newaxis, :]
segs = np.zeros((50, 100, 2), float)
segs[:, :, 1] = ys
segs[:, :, 0] = x
# Mask some values to test masked array support:
segs = np.ma.masked_where((segs > 50) & (segs < 60), segs)
# We need to set the plot limits.
ax = plt.axes()
ax.set_xlim(x.min(), x.max())
ax.set_ylim(ys.min(), ys.max())
# colors is sequence of rgba tuples
# linestyle is a string or dash tuple. Legal string values are
# solid|dashed|dashdot|dotted. The dash tuple is (offset, onoffseq)
# where onoffseq is an even length tuple of on and off ink in points.
# If linestyle is omitted, 'solid' is used
# See matplotlib.collections.LineCollection for more information
colors = [colorConverter.to_rgba(i) for i in 'bgrcmyk']
line_segments = LineCollection(segs, linewidths=(0.5, 1, 1.5, 2),
colors=colors, linestyle='solid')
ax.add_collection(line_segments)
ax.set_title('Line collection with masked arrays')
plt.show()
Keywords: python, matplotlib, pylab, example, codex (see Search examples)