Learn what to expect in the new updates


(Source code, png, hires.png, pdf)
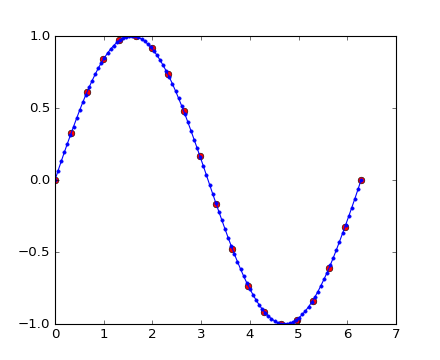
import matplotlib.pyplot as plt
from numpy import pi, sin, linspace
from matplotlib.mlab import stineman_interp

x = linspace(0, 2*pi, 20)
y = sin(x)
yp = None
xi = linspace(x[0], x[-1], 100)
yi = stineman_interp(xi, x, y, yp)

fig, ax = plt.subplots()
ax.plot(x, y, 'ro', xi, yi, '-b.')
plt.show()
Keywords: python, matplotlib, pylab, example, codex (see Search examples)