Learn what to expect in the new updates


(Source code, png, hires.png, pdf)

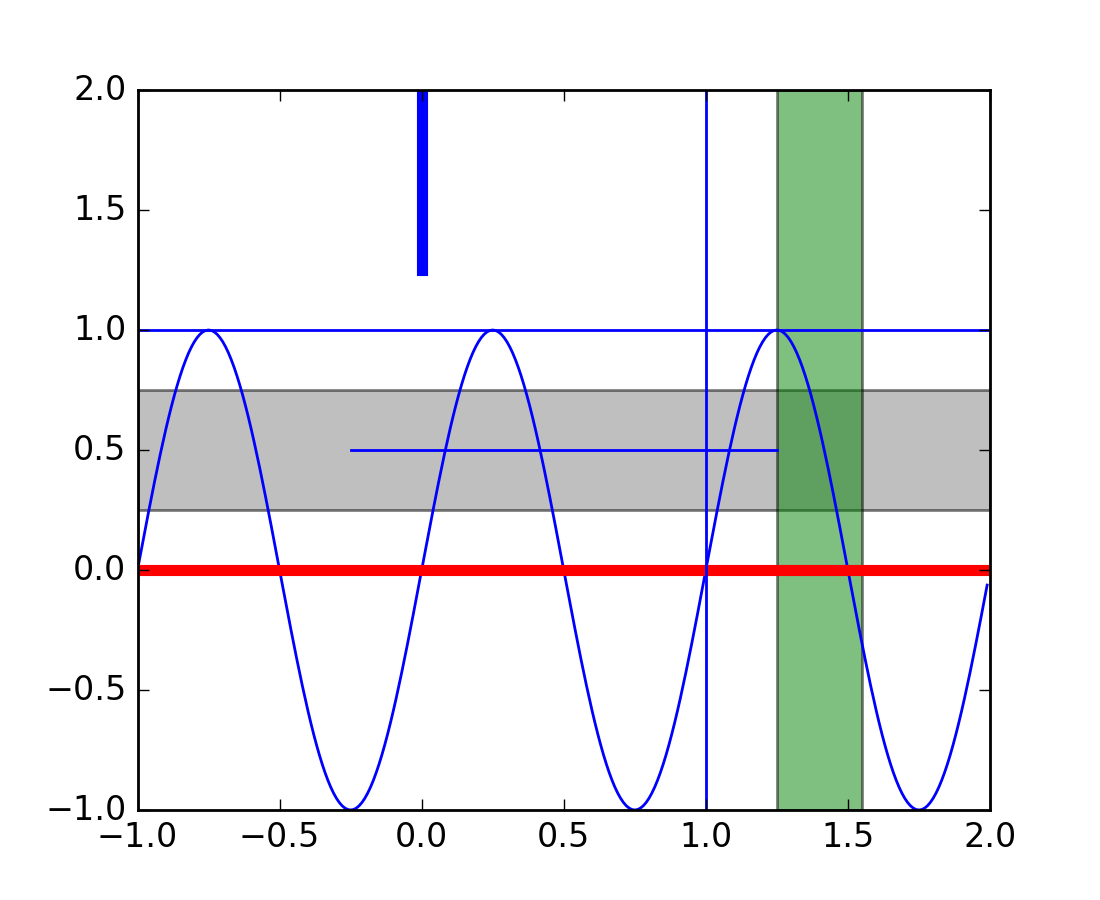
import numpy as np
import matplotlib.pyplot as plt

t = np.arange(-1, 2, .01)
s = np.sin(2*np.pi*t)

plt.plot(t, s)
# draw a thick red hline at y=0 that spans the xrange
l = plt.axhline(linewidth=4, color='r')

# draw a default hline at y=1 that spans the xrange
l = plt.axhline(y=1)

# draw a default vline at x=1 that spans the yrange
l = plt.axvline(x=1)

# draw a thick blue vline at x=0 that spans the upper quadrant of
# the yrange
l = plt.axvline(x=0, ymin=0.75, linewidth=4, color='b')

# draw a default hline at y=.5 that spans the middle half of
# the axes
l = plt.axhline(y=.5, xmin=0.25, xmax=0.75)

p = plt.axhspan(0.25, 0.75, facecolor='0.5', alpha=0.5)

p = plt.axvspan(1.25, 1.55, facecolor='g', alpha=0.5)

plt.axis([-1, 2, -1, 2])


plt.show()
Keywords: python, matplotlib, pylab, example, codex (see Search examples)