Learn what to expect in the new updates


"""
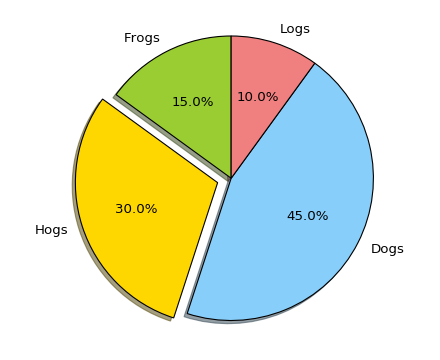
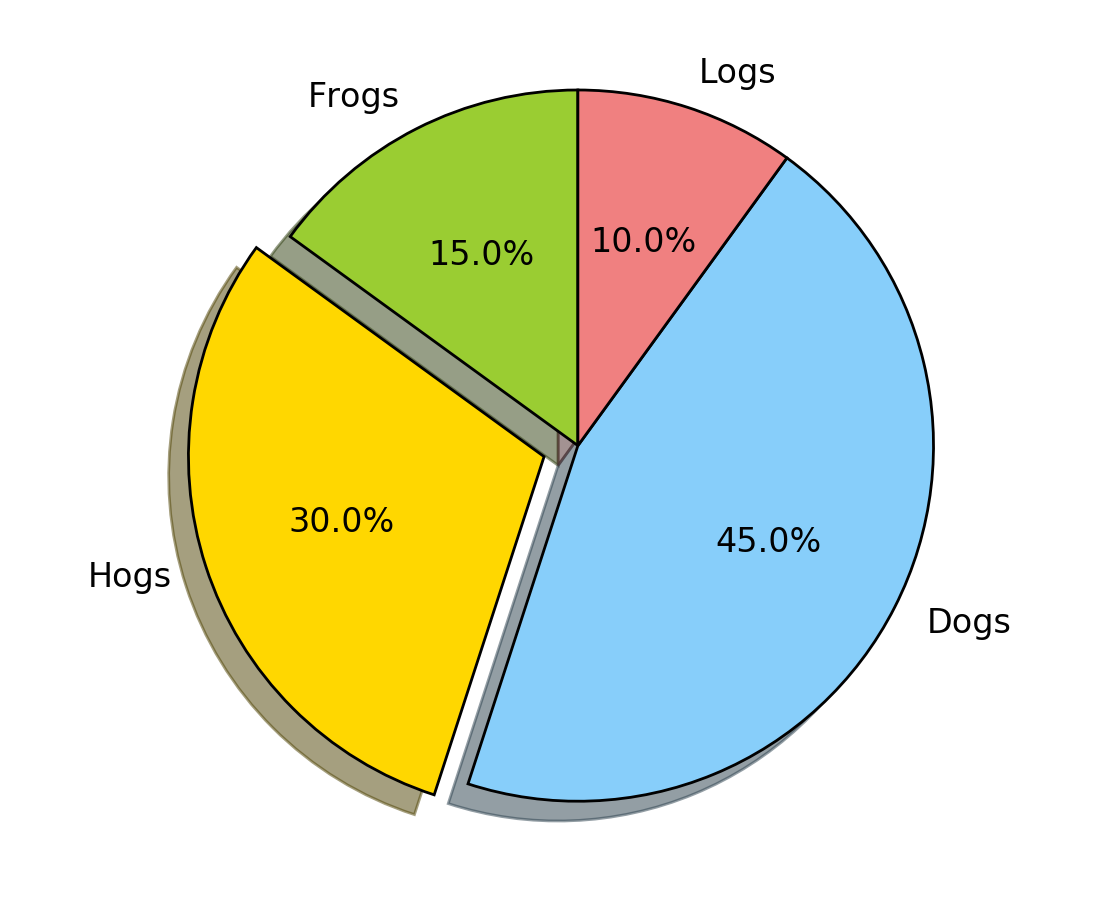
Demo of a basic pie chart plus a few additional features.
In addition to the basic pie chart, this demo shows a few optional features:
* slice labels
* auto-labeling the percentage
* offsetting a slice with "explode"
* drop-shadow
* custom start angle
Note about the custom start angle:
The default ``startangle`` is 0, which would start the "Frogs" slice on the
positive x-axis. This example sets ``startangle = 90`` such that everything is
rotated counter-clockwise by 90 degrees, and the frog slice starts on the
positive y-axis.
"""
import matplotlib.pyplot as plt
# The slices will be ordered and plotted counter-clockwise.
labels = 'Frogs', 'Hogs', 'Dogs', 'Logs'
sizes = [15, 30, 45, 10]
colors = ['yellowgreen', 'gold', 'lightskyblue', 'lightcoral']
explode = (0, 0.1, 0, 0) # only "explode" the 2nd slice (i.e. 'Hogs')
plt.pie(sizes, explode=explode, labels=labels, colors=colors,
autopct='%1.1f%%', shadow=True, startangle=90)
# Set aspect ratio to be equal so that pie is drawn as a circle.
plt.axis('equal')
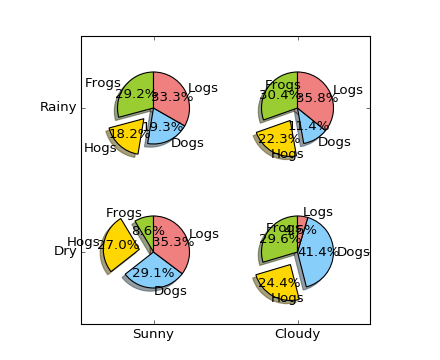
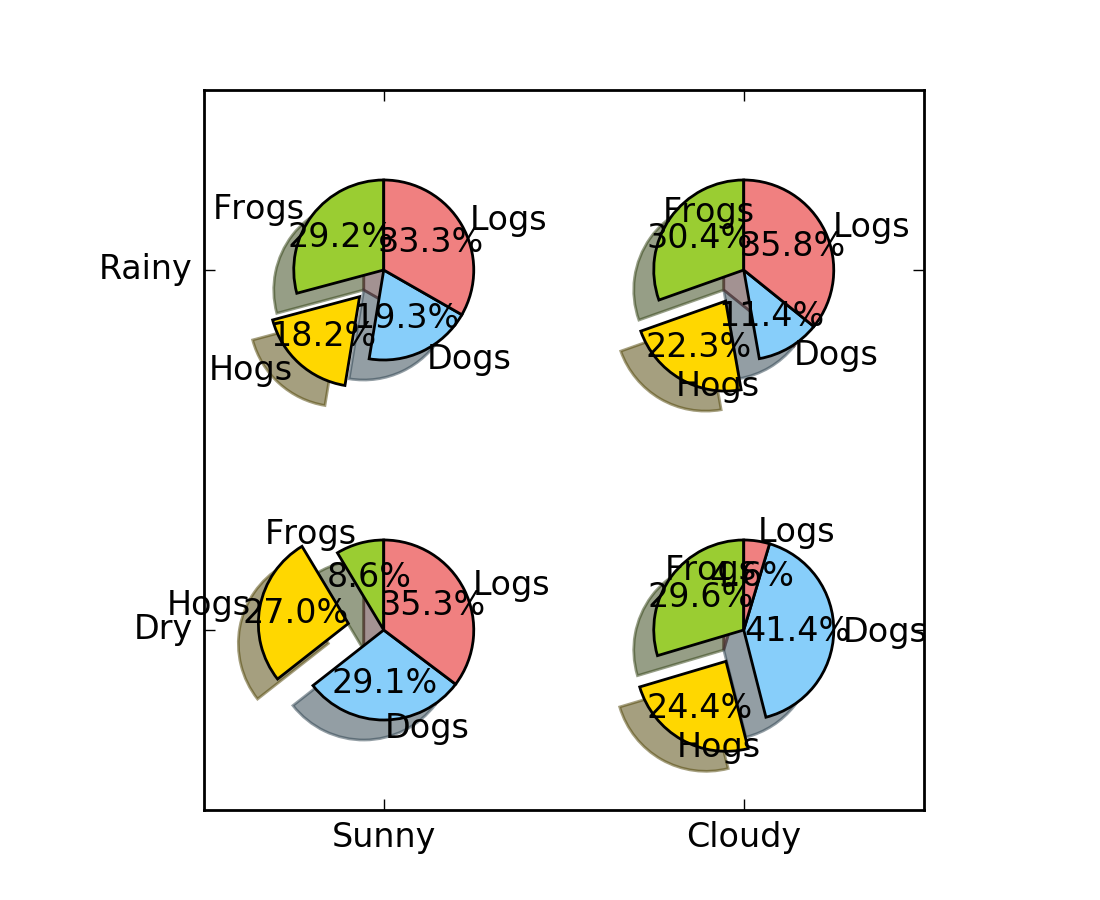
fig = plt.figure()
ax = fig.gca()
import numpy as np
ax.pie(np.random.random(4), explode=explode, labels=labels, colors=colors,
autopct='%1.1f%%', shadow=True, startangle=90,
radius=0.25, center=(0, 0), frame=True)
ax.pie(np.random.random(4), explode=explode, labels=labels, colors=colors,
autopct='%1.1f%%', shadow=True, startangle=90,
radius=0.25, center=(1, 1), frame=True)
ax.pie(np.random.random(4), explode=explode, labels=labels, colors=colors,
autopct='%1.1f%%', shadow=True, startangle=90,
radius=0.25, center=(0, 1), frame=True)
ax.pie(np.random.random(4), explode=explode, labels=labels, colors=colors,
autopct='%1.1f%%', shadow=True, startangle=90,
radius=0.25, center=(1, 0), frame=True)
ax.set_xticks([0, 1])
ax.set_yticks([0, 1])
ax.set_xticklabels(["Sunny", "Cloudy"])
ax.set_yticklabels(["Dry", "Rainy"])
ax.set_xlim((-0.5, 1.5))
ax.set_ylim((-0.5, 1.5))
# Set aspect ratio to be equal so that pie is drawn as a circle.
ax.set_aspect('equal')
plt.show()
Keywords: python, matplotlib, pylab, example, codex (see Search examples)