Learn what to expect in the new updates


(Source code, png, hires.png, pdf)

"""
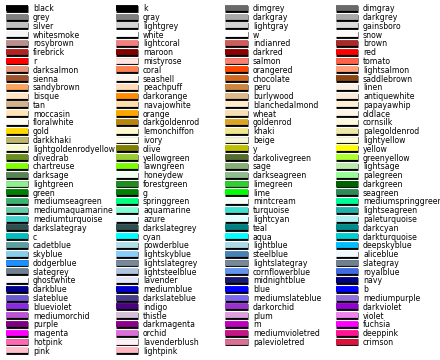
Visualization of named colors.
Simple plot example with the named colors and its visual representation.
"""
from __future__ import (absolute_import, division, print_function,
unicode_literals)
import six
import numpy as np
import matplotlib.pyplot as plt
from matplotlib import colors
colors_ = list(six.iteritems(colors.cnames))
# Add the single letter colors.
for name, rgb in six.iteritems(colors.ColorConverter.colors):
hex_ = colors.rgb2hex(rgb)
colors_.append((name, hex_))
# Transform to hex color values.
hex_ = [color[1] for color in colors_]
# Get the rgb equivalent.
rgb = [colors.hex2color(color) for color in hex_]
# Get the hsv equivalent.
hsv = [colors.rgb_to_hsv(color) for color in rgb]
# Split the hsv values to sort.
hue = [color[0] for color in hsv]
sat = [color[1] for color in hsv]
val = [color[2] for color in hsv]
# Sort by hue, saturation and value.
ind = np.lexsort((val, sat, hue))
sorted_colors = [colors_[i] for i in ind]
n = len(sorted_colors)
ncols = 4
nrows = int(np.ceil(1. * n / ncols))
fig, ax = plt.subplots()
X, Y = fig.get_dpi() * fig.get_size_inches()
# row height
h = Y / (nrows + 1)
# col width
w = X / ncols
for i, (name, color) in enumerate(sorted_colors):
col = i % ncols
row = int(i / ncols)
y = Y - (row * h) - h
xi_line = w * (col + 0.05)
xf_line = w * (col + 0.25)
xi_text = w * (col + 0.3)
ax.text(xi_text, y, name, fontsize=(h * 0.8),
horizontalalignment='left',
verticalalignment='center')
# Add extra black line a little bit thicker to make
# clear colors more visible.
ax.hlines(y, xi_line, xf_line, color='black', linewidth=(h * 0.7))
ax.hlines(y + h * 0.1, xi_line, xf_line, color=color, linewidth=(h * 0.6))
ax.set_xlim(0, X)
ax.set_ylim(0, Y)
ax.set_axis_off()
fig.subplots_adjust(left=0, right=1,
top=1, bottom=0,
hspace=0, wspace=0)
plt.show()
Keywords: python, matplotlib, pylab, example, codex (see Search examples)