Learn what to expect in the new updates


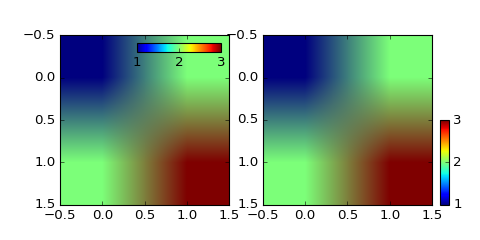
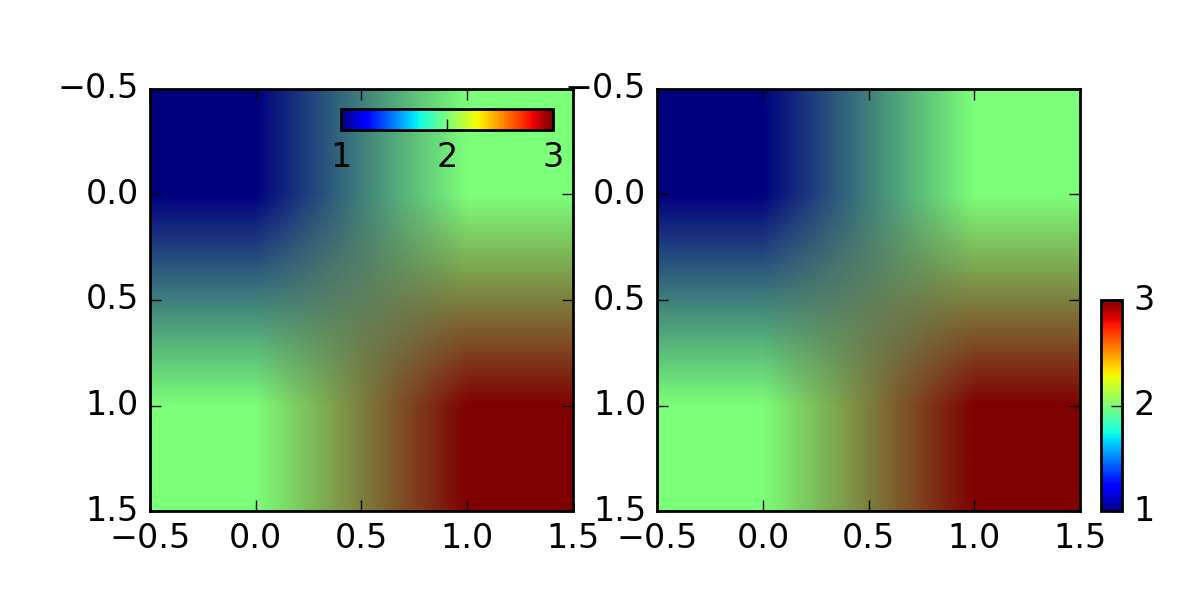
(Source code, png, hires.png, pdf)
import matplotlib.pyplot as plt

from mpl_toolkits.axes_grid1.inset_locator import inset_axes

fig, (ax1, ax2) = plt.subplots(1, 2, figsize=[6, 3])

axins1 = inset_axes(ax1,
                    width="50%",  # width = 10% of parent_bbox width
                    height="5%",  # height : 50%
                    loc=1)

im1 = ax1.imshow([[1, 2], [2, 3]])
plt.colorbar(im1, cax=axins1, orientation="horizontal", ticks=[1, 2, 3])
axins1.xaxis.set_ticks_position("bottom")

axins = inset_axes(ax2,
                   width="5%",  # width = 10% of parent_bbox width
                   height="50%",  # height : 50%
                   loc=3,
                   bbox_to_anchor=(1.05, 0., 1, 1),
                   bbox_transform=ax2.transAxes,
                   borderpad=0,
                   )

# Controlling the placement of the inset axes is basically same as that
# of the legend.  you may want to play with the borderpad value and
# the bbox_to_anchor coordinate.

im = ax2.imshow([[1, 2], [2, 3]])
plt.colorbar(im, cax=axins, ticks=[1, 2, 3])

plt.draw()
plt.show()
Keywords: python, matplotlib, pylab, example, codex (see Search examples)