Learn what to expect in the new updates


(Source code, png, hires.png, pdf)
#!/usr/bin/python
from matplotlib import pyplot as plt
import matplotlib.colors as mcolors
import numpy as np
from numpy.random import multivariate_normal
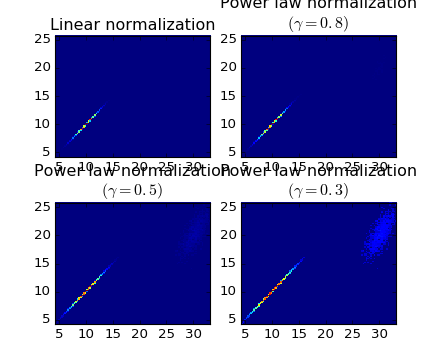
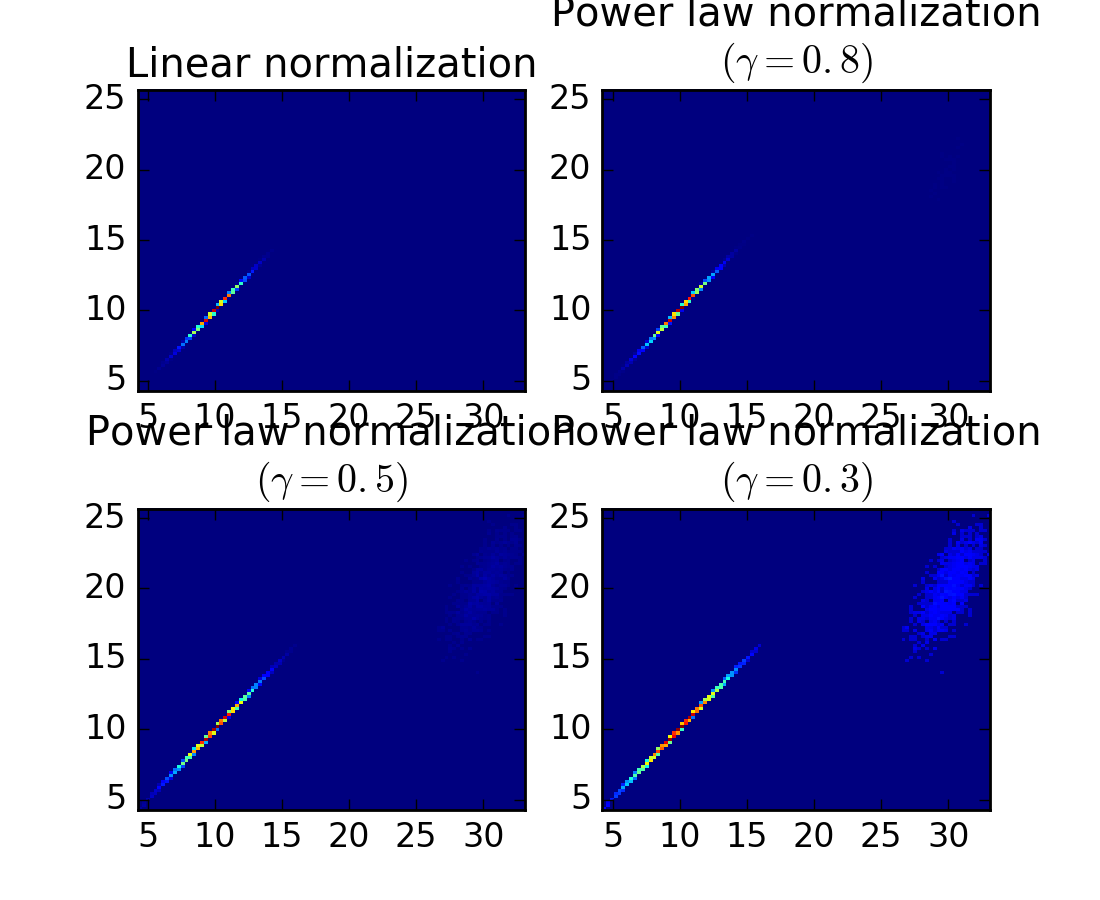
data = np.vstack([multivariate_normal([10, 10], [[2, 2], [2, 2]], size=100000),
multivariate_normal([30, 20], [[2, 3], [1, 3]], size=1000)
])
gammas = [0.8, 0.5, 0.3]
xgrid = np.floor((len(gammas) + 1.) / 2)
ygrid = np.ceil((len(gammas) + 1.) / 2)
plt.subplot(xgrid, ygrid, 1)
plt.title('Linear normalization')
plt.hist2d(data[:, 0], data[:, 1], bins=100)
for i, gamma in enumerate(gammas):
plt.subplot(xgrid, ygrid, i + 2)
plt.title('Power law normalization\n$(\gamma=%1.1f)$' % gamma)
plt.hist2d(data[:, 0], data[:, 1],
bins=100, norm=mcolors.PowerNorm(gamma))
plt.subplots_adjust(hspace=0.39)
plt.show()
Keywords: python, matplotlib, pylab, example, codex (see Search examples)