Learn what to expect in the new updates

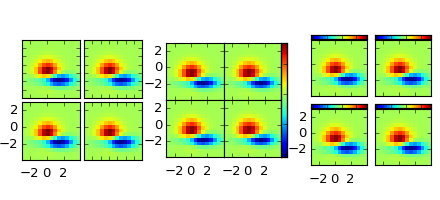
The matplotlib AxesGrid toolkit is a collection of helper classes to ease displaying multiple images in matplotlib. While the aspect parameter in matplotlib adjust the position of the single axes, AxesGrid toolkit provides a framework to adjust the position of multiple axes according to their aspects.
Note
AxesGrid toolkit has been a part of matplotlib since v 0.99. Originally, the toolkit had a single namespace of axes_grid. In more recent version (since svn r8226), the toolkit has divided into two separate namespace (axes_grid1 and axisartist). While axes_grid namespace is maintained for the backward compatibility, use of axes_grid1 and axisartist is recommended.
Warning
axes_grid and axisartist (but not axes_grid1) uses a custom Axes class (derived from the mpl’s original Axes class). As a side effect, some commands (mostly tick-related) do not work. Use axes_grid1 to avoid this, or see how things are different in axes_grid and axisartist (LINK needed)