Learn what to expect in the new updates

(Source code, png, hires.png, pdf)

"""
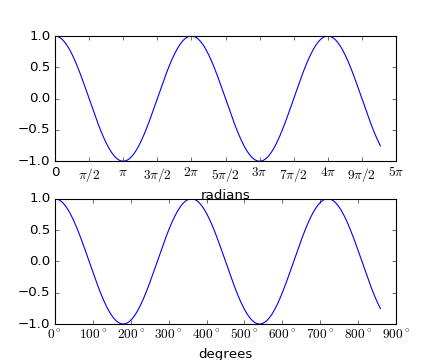
Plot with radians from the basic_units mockup example package
This example shows how the unit class can determine the tick locating,
formatting and axis labeling.
"""
import numpy as np
from basic_units import radians, degrees, cos
from matplotlib.pyplot import figure, show
x = [val*radians for val in np.arange(0, 15, 0.01)]
fig = figure()
fig.subplots_adjust(hspace=0.3)
ax = fig.add_subplot(211)
line1, = ax.plot(x, cos(x), xunits=radians)
ax = fig.add_subplot(212)
line2, = ax.plot(x, cos(x), xunits=degrees)
show()
Keywords: python, matplotlib, pylab, example, codex (see Search examples)