Learn what to expect in the new updates

(Source code, png, hires.png, pdf)
"""
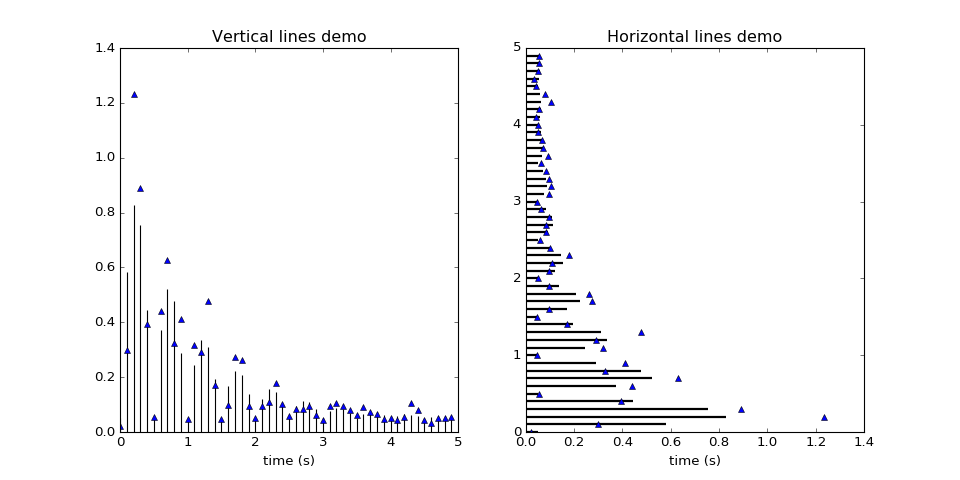
Small demonstration of the hlines and vlines plots.
"""
import matplotlib.pyplot as plt
import numpy as np
import numpy.random as rnd
def f(t):
s1 = np.sin(2 * np.pi * t)
e1 = np.exp(-t)
return np.absolute((s1 * e1)) + .05
t = np.arange(0.0, 5.0, 0.1)
s = f(t)
nse = rnd.normal(0.0, 0.3, t.shape) * s
fig = plt.figure(figsize=(12, 6))
vax = fig.add_subplot(121)
hax = fig.add_subplot(122)
vax.plot(t, s + nse, 'b^')
vax.vlines(t, [0], s)
vax.set_xlabel('time (s)')
vax.set_title('Vertical lines demo')
hax.plot(s + nse, t, 'b^')
hax.hlines(t, [0], s, lw=2)
hax.set_xlabel('time (s)')
hax.set_title('Horizontal lines demo')
plt.show()
Keywords: python, matplotlib, pylab, example, codex (see Search examples)