Learn what to expect in the new updates

(Source code, png, hires.png, pdf)
"""
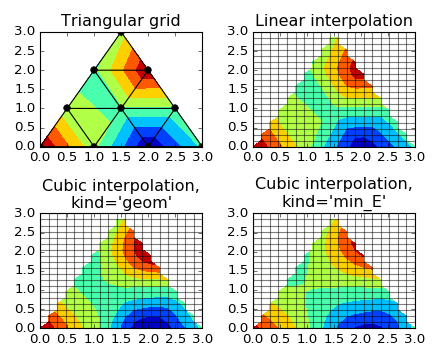
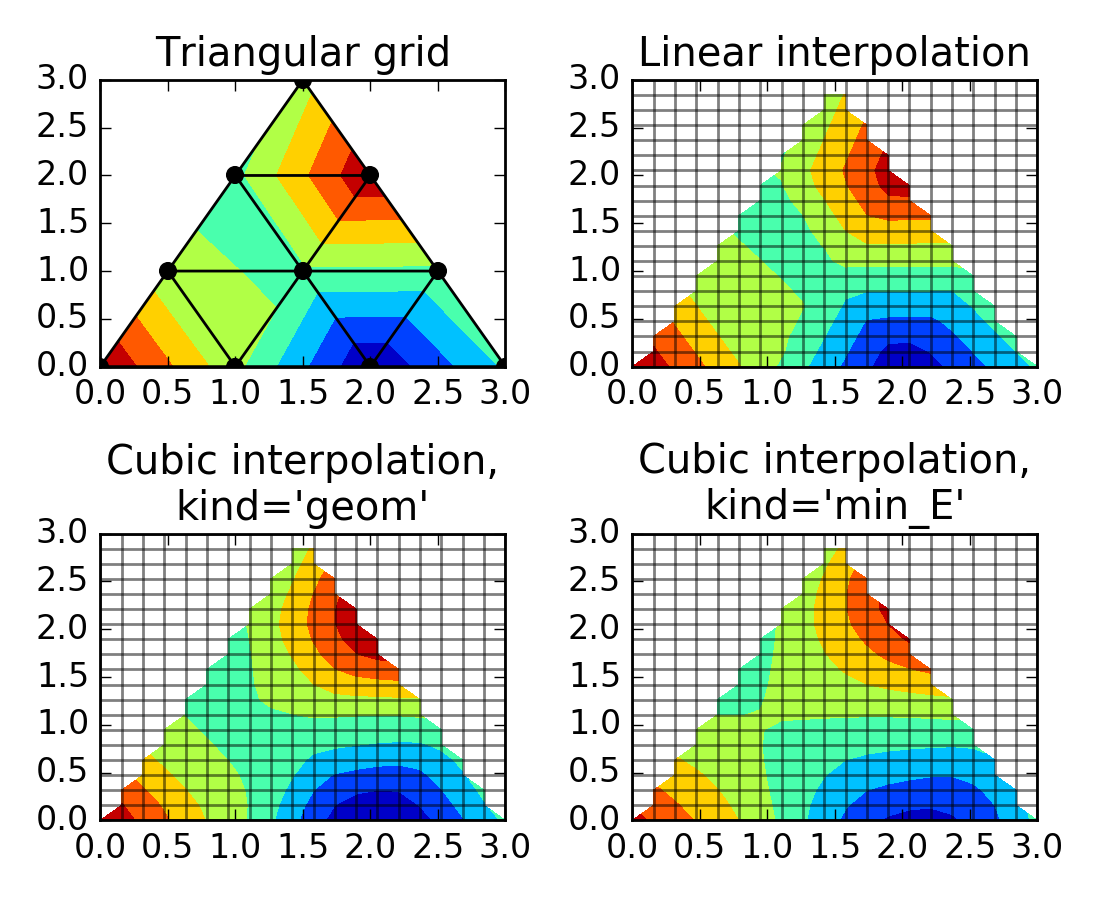
Interpolation from triangular grid to quad grid.
"""
import matplotlib.pyplot as plt
import matplotlib.tri as mtri
import numpy as np
# Create triangulation.
x = np.asarray([0, 1, 2, 3, 0.5, 1.5, 2.5, 1, 2, 1.5])
y = np.asarray([0, 0, 0, 0, 1.0, 1.0, 1.0, 2, 2, 3.0])
triangles = [[0, 1, 4], [1, 2, 5], [2, 3, 6], [1, 5, 4], [2, 6, 5], [4, 5, 7],
[5, 6, 8], [5, 8, 7], [7, 8, 9]]
triang = mtri.Triangulation(x, y, triangles)
# Interpolate to regularly-spaced quad grid.
z = np.cos(1.5*x)*np.cos(1.5*y)
xi, yi = np.meshgrid(np.linspace(0, 3, 20), np.linspace(0, 3, 20))
interp_lin = mtri.LinearTriInterpolator(triang, z)
zi_lin = interp_lin(xi, yi)
interp_cubic_geom = mtri.CubicTriInterpolator(triang, z, kind='geom')
zi_cubic_geom = interp_cubic_geom(xi, yi)
interp_cubic_min_E = mtri.CubicTriInterpolator(triang, z, kind='min_E')
zi_cubic_min_E = interp_cubic_min_E(xi, yi)
# Plot the triangulation.
plt.subplot(221)
plt.tricontourf(triang, z)
plt.triplot(triang, 'ko-')
plt.title('Triangular grid')
# Plot linear interpolation to quad grid.
plt.subplot(222)
plt.contourf(xi, yi, zi_lin)
plt.plot(xi, yi, 'k-', alpha=0.5)
plt.plot(xi.T, yi.T, 'k-', alpha=0.5)
plt.title("Linear interpolation")
# Plot cubic interpolation to quad grid, kind=geom
plt.subplot(223)
plt.contourf(xi, yi, zi_cubic_geom)
plt.plot(xi, yi, 'k-', alpha=0.5)
plt.plot(xi.T, yi.T, 'k-', alpha=0.5)
plt.title("Cubic interpolation,\nkind='geom'")
# Plot cubic interpolation to quad grid, kind=min_E
plt.subplot(224)
plt.contourf(xi, yi, zi_cubic_min_E)
plt.plot(xi, yi, 'k-', alpha=0.5)
plt.plot(xi.T, yi.T, 'k-', alpha=0.5)
plt.title("Cubic interpolation,\nkind='min_E'")
plt.tight_layout()
plt.show()
Keywords: python, matplotlib, pylab, example, codex (see Search examples)