Learn what to expect in the new updates

(Source code, png, hires.png, pdf)


import numpy as np
import matplotlib.pyplot as plt
def fnx():
return np.random.randint(5, 50, 10)
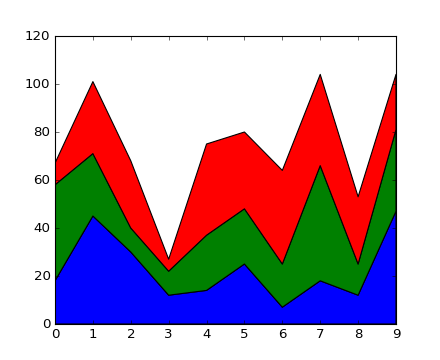
y = np.row_stack((fnx(), fnx(), fnx()))
x = np.arange(10)
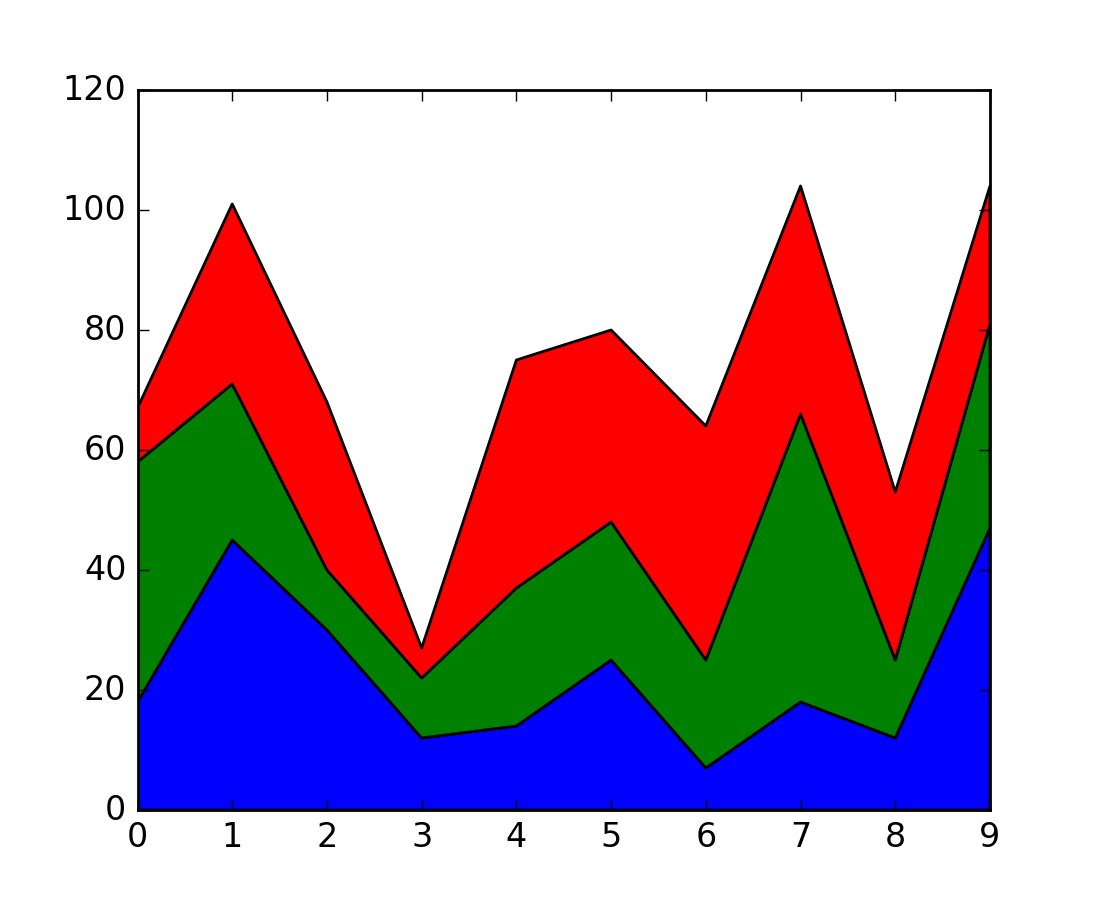
y1, y2, y3 = fnx(), fnx(), fnx()
fig, ax = plt.subplots()
ax.stackplot(x, y)
plt.show()
fig, ax = plt.subplots()
ax.stackplot(x, y1, y2, y3)
plt.show()
Keywords: python, matplotlib, pylab, example, codex (see Search examples)