Learn what to expect in the new updates

(Source code, png, hires.png, pdf)
"""
You can share the x or y axis limits for one axis with another by
passing an axes instance as a sharex or sharey kwarg.
Changing the axis limits on one axes will be reflected automatically
in the other, and vice-versa, so when you navigate with the toolbar
the axes will follow each other on their shared axes. Ditto for
changes in the axis scaling (e.g., log vs linear). However, it is
possible to have differences in tick labeling, e.g., you can selectively
turn off the tick labels on one axes.
The example below shows how to customize the tick labels on the
various axes. Shared axes share the tick locator, tick formatter,
view limits, and transformation (e.g., log, linear). But the ticklabels
themselves do not share properties. This is a feature and not a bug,
because you may want to make the tick labels smaller on the upper
axes, e.g., in the example below.
If you want to turn off the ticklabels for a given axes (e.g., on
subplot(211) or subplot(212), you cannot do the standard trick
setp(ax2, xticklabels=[])
because this changes the tick Formatter, which is shared among all
axes. But you can alter the visibility of the labels, which is a
property
setp( ax2.get_xticklabels(), visible=False)
"""
import matplotlib.pyplot as plt
import numpy as np
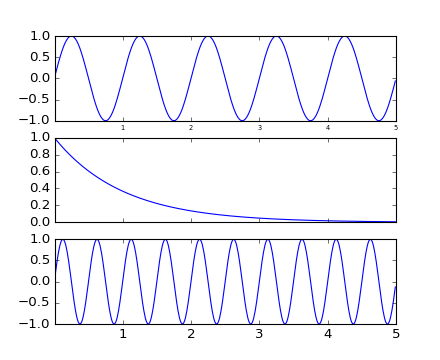
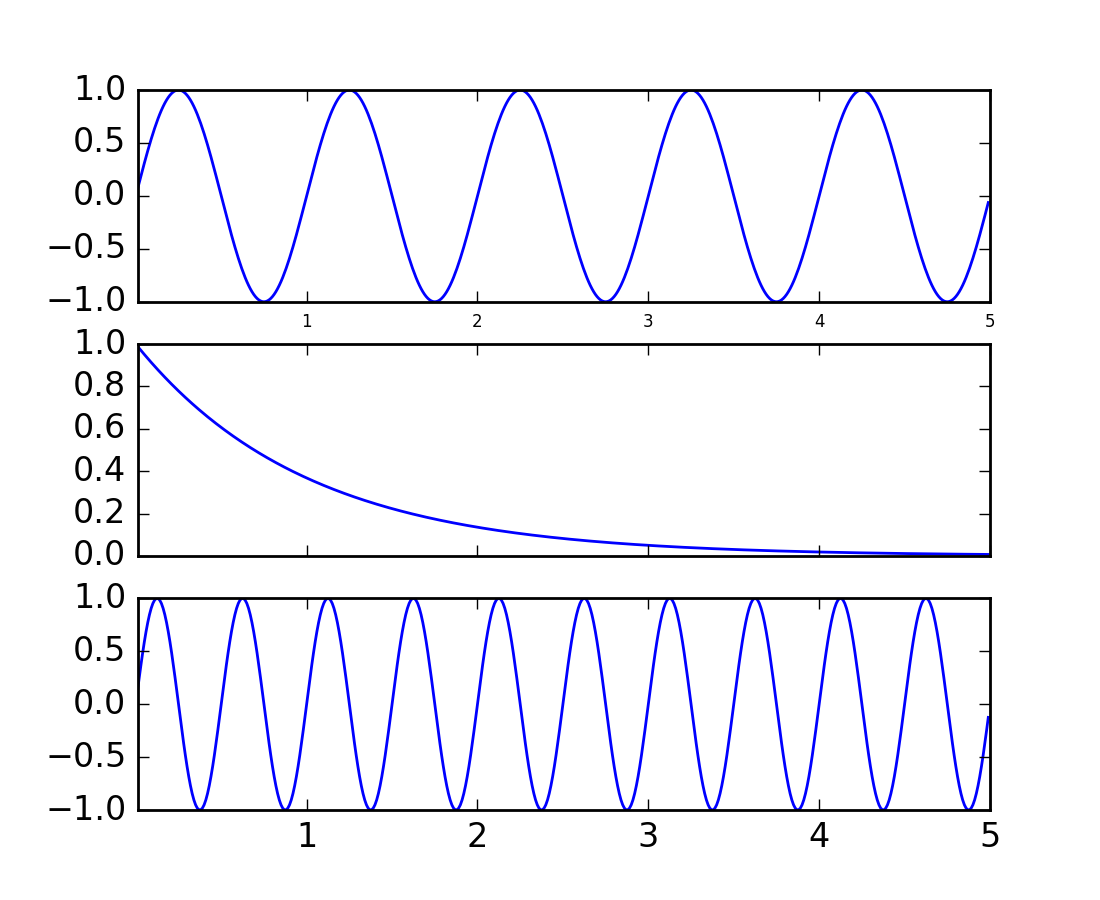
t = np.arange(0.01, 5.0, 0.01)
s1 = np.sin(2*np.pi*t)
s2 = np.exp(-t)
s3 = np.sin(4*np.pi*t)
ax1 = plt.subplot(311)
plt.plot(t, s1)
plt.setp(ax1.get_xticklabels(), fontsize=6)
# share x only
ax2 = plt.subplot(312, sharex=ax1)
plt.plot(t, s2)
# make these tick labels invisible
plt.setp(ax2.get_xticklabels(), visible=False)
# share x and y
ax3 = plt.subplot(313, sharex=ax1, sharey=ax1)
plt.plot(t, s3)
plt.xlim(0.01, 5.0)
plt.show()
Keywords: python, matplotlib, pylab, example, codex (see Search examples)