Learn what to expect in the new updates

(Source code, png, hires.png, pdf)
"""
N Classic Base renderer Ext renderer
20 0.22 0.14 0.14
100 0.16 0.14 0.13
1000 0.45 0.26 0.17
10000 3.30 1.31 0.53
50000 19.30 6.53 1.98
"""
from __future__ import print_function # only needed for python 2.x
import matplotlib.pyplot as plt
import numpy as np
import time
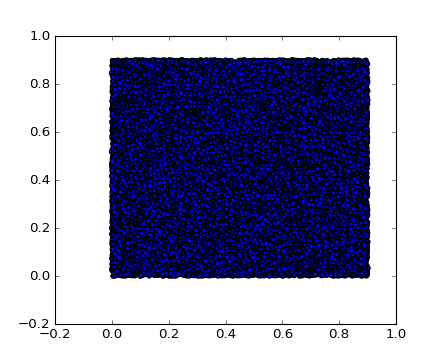
for N in (20, 100, 1000, 10000, 50000):
tstart = time.time()
x = 0.9*np.random.rand(N)
y = 0.9*np.random.rand(N)
s = 20*np.random.rand(N)
plt.scatter(x, y, s)
print('%d symbols in %1.2f s' % (N, time.time() - tstart))
Keywords: python, matplotlib, pylab, example, codex (see Search examples)