Learn what to expect in the new updates

# Working with multiple figure windows and subplots
import matplotlib.pyplot as plt
import numpy as np
t = np.arange(0.0, 2.0, 0.01)
s1 = np.sin(2*np.pi*t)
s2 = np.sin(4*np.pi*t)
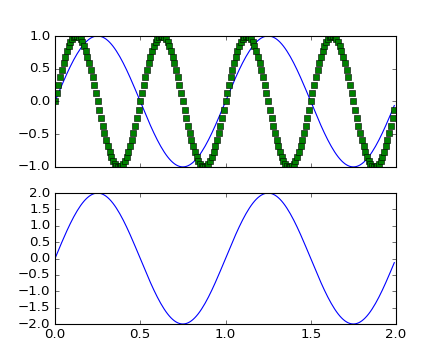
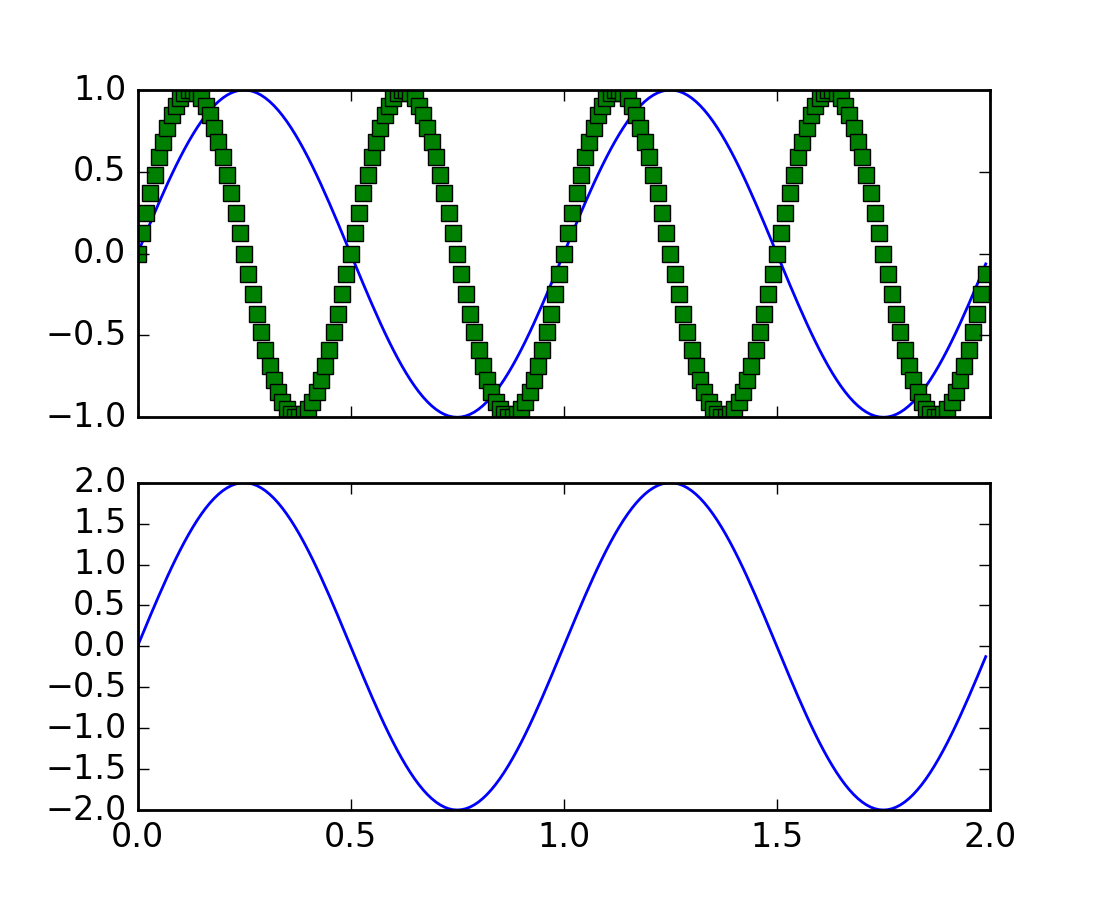
plt.figure(1)
plt.subplot(211)
plt.plot(t, s1)
plt.subplot(212)
plt.plot(t, 2*s1)
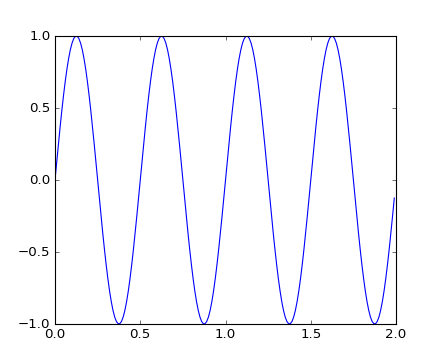
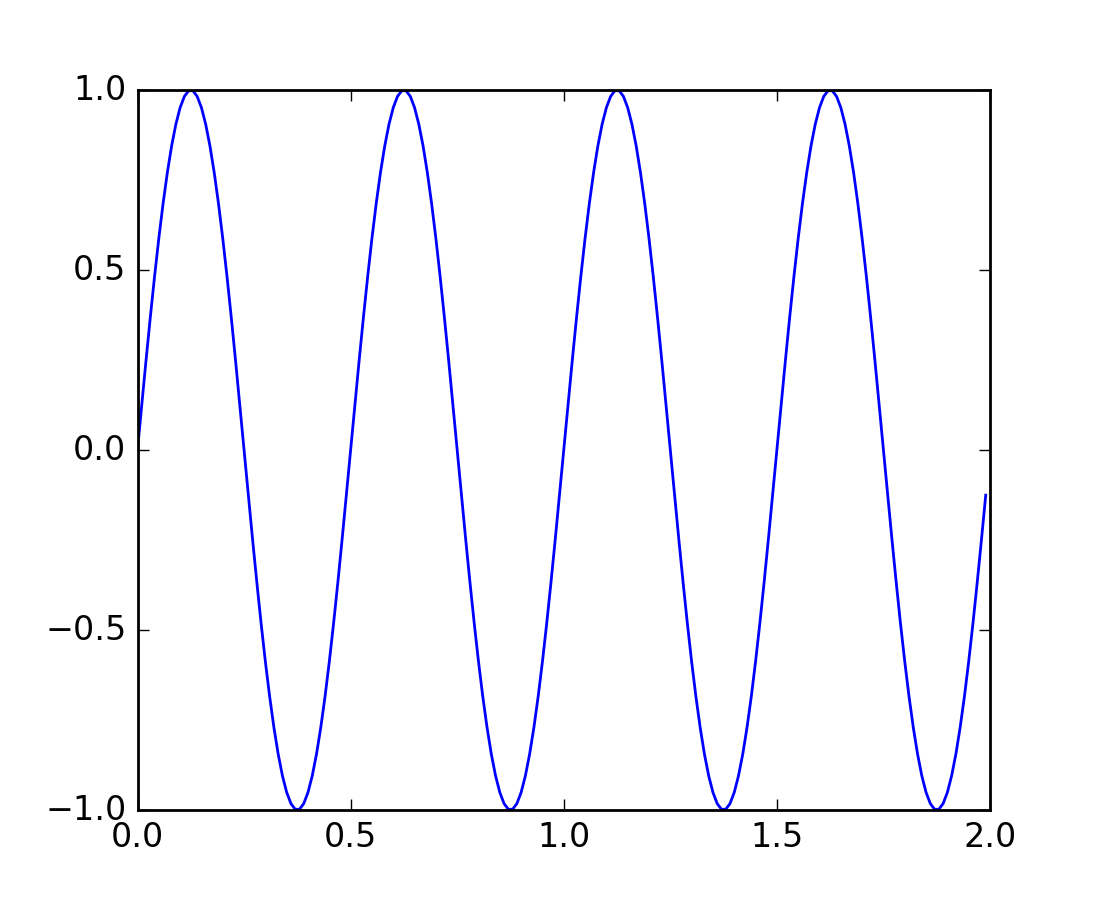
plt.figure(2)
plt.plot(t, s2)
# now switch back to figure 1 and make some changes
plt.figure(1)
plt.subplot(211)
plt.plot(t, s2, 'gs')
ax = plt.gca()
ax.set_xticklabels([])
plt.show()
Keywords: python, matplotlib, pylab, example, codex (see Search examples)