Learn what to expect in the new updates

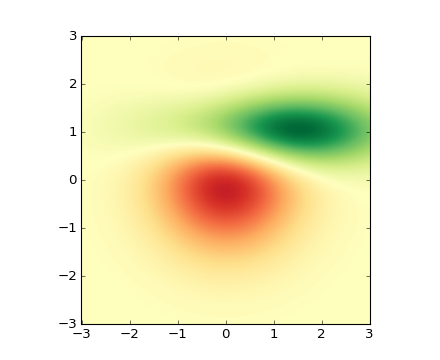
(Source code, png, hires.png, pdf)

#!/usr/bin/env python
import numpy as np
import matplotlib.cm as cm
import matplotlib.mlab as mlab
import matplotlib.pyplot as plt

delta = 0.025
x = y = np.arange(-3.0, 3.0, delta)
X, Y = np.meshgrid(x, y)
Z1 = mlab.bivariate_normal(X, Y, 1.0, 1.0, 0.0, 0.0)
Z2 = mlab.bivariate_normal(X, Y, 1.5, 0.5, 1, 1)
Z = Z2 - Z1  # difference of Gaussians

im = plt.imshow(Z, interpolation='bilinear', cmap=cm.RdYlGn,
                origin='lower', extent=[-3, 3, -3, 3],
                vmax=abs(Z).max(), vmin=-abs(Z).max())

plt.show()
Keywords: python, matplotlib, pylab, example, codex (see Search examples)