Learn what to expect in the new updates

(Source code, png, hires.png, pdf)
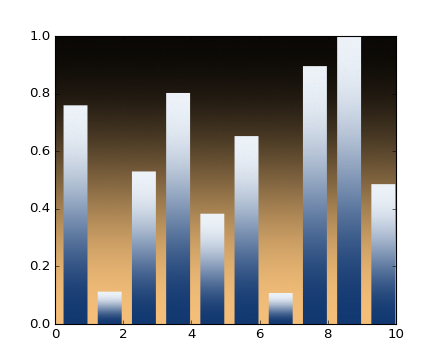
from matplotlib.pyplot import figure, show, cm
from numpy import arange
from numpy.random import rand


def gbar(ax, x, y, width=0.5, bottom=0):
    X = [[.6, .6], [.7, .7]]
    for left, top in zip(x, y):
        right = left + width
        ax.imshow(X, interpolation='bicubic', cmap=cm.Blues,
                  extent=(left, right, bottom, top), alpha=1)

fig = figure()

xmin, xmax = xlim = 0, 10
ymin, ymax = ylim = 0, 1
ax = fig.add_subplot(111, xlim=xlim, ylim=ylim,
                     autoscale_on=False)
X = [[.6, .6], [.7, .7]]

ax.imshow(X, interpolation='bicubic', cmap=cm.copper,
          extent=(xmin, xmax, ymin, ymax), alpha=1)

N = 10
x = arange(N) + 0.25
y = rand(N)
gbar(ax, x, y, width=0.7)
ax.set_aspect('auto')
show()
Keywords: python, matplotlib, pylab, example, codex (see Search examples)