Learn what to expect in the new updates

(Source code, png, hires.png, pdf)
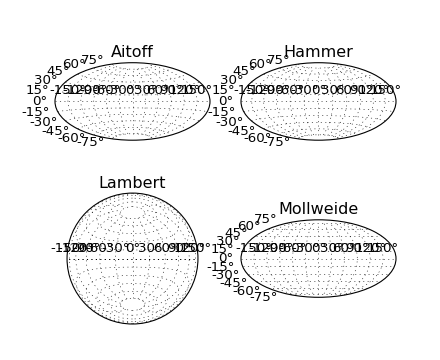
import matplotlib.pyplot as plt

plt.subplot(221, projection="aitoff")
plt.title("Aitoff")
plt.grid(True)

plt.subplot(222, projection="hammer")
plt.title("Hammer")
plt.grid(True)

plt.subplot(223, projection="lambert")
plt.title("Lambert")
plt.grid(True)

plt.subplot(224, projection="mollweide")
plt.title("Mollweide")
plt.grid(True)

plt.show()
Keywords: python, matplotlib, pylab, example, codex (see Search examples)