Learn what to expect in the new updates

(Source code, png, hires.png, pdf)

from matplotlib.font_manager import FontProperties
import matplotlib.pyplot as plt
import numpy as np
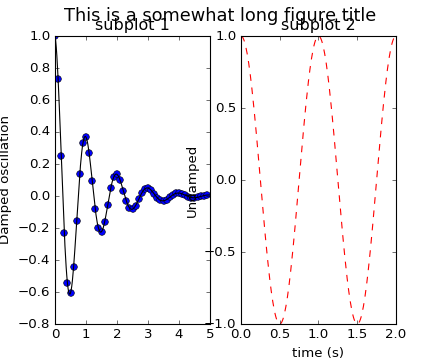
def f(t):
s1 = np.cos(2*np.pi*t)
e1 = np.exp(-t)
return s1 * e1
t1 = np.arange(0.0, 5.0, 0.1)
t2 = np.arange(0.0, 5.0, 0.02)
t3 = np.arange(0.0, 2.0, 0.01)
plt.subplot(121)
plt.plot(t1, f(t1), 'bo', t2, f(t2), 'k')
plt.title('subplot 1')
plt.ylabel('Damped oscillation')
plt.suptitle('This is a somewhat long figure title', fontsize=16)
plt.subplot(122)
plt.plot(t3, np.cos(2*np.pi*t3), 'r--')
plt.xlabel('time (s)')
plt.title('subplot 2')
plt.ylabel('Undamped')
plt.show()
Keywords: python, matplotlib, pylab, example, codex (see Search examples)