Learn what to expect in the new updates

(Source code, png, hires.png, pdf)

'''This example is only interesting when ran in interactive mode'''
import matplotlib.pyplot as plt
import numpy as np
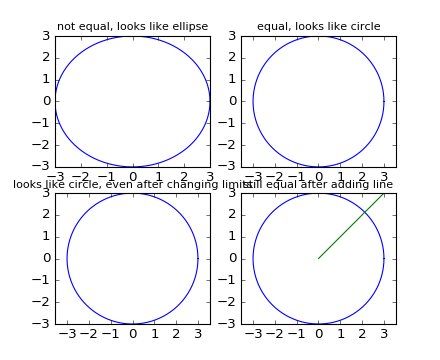
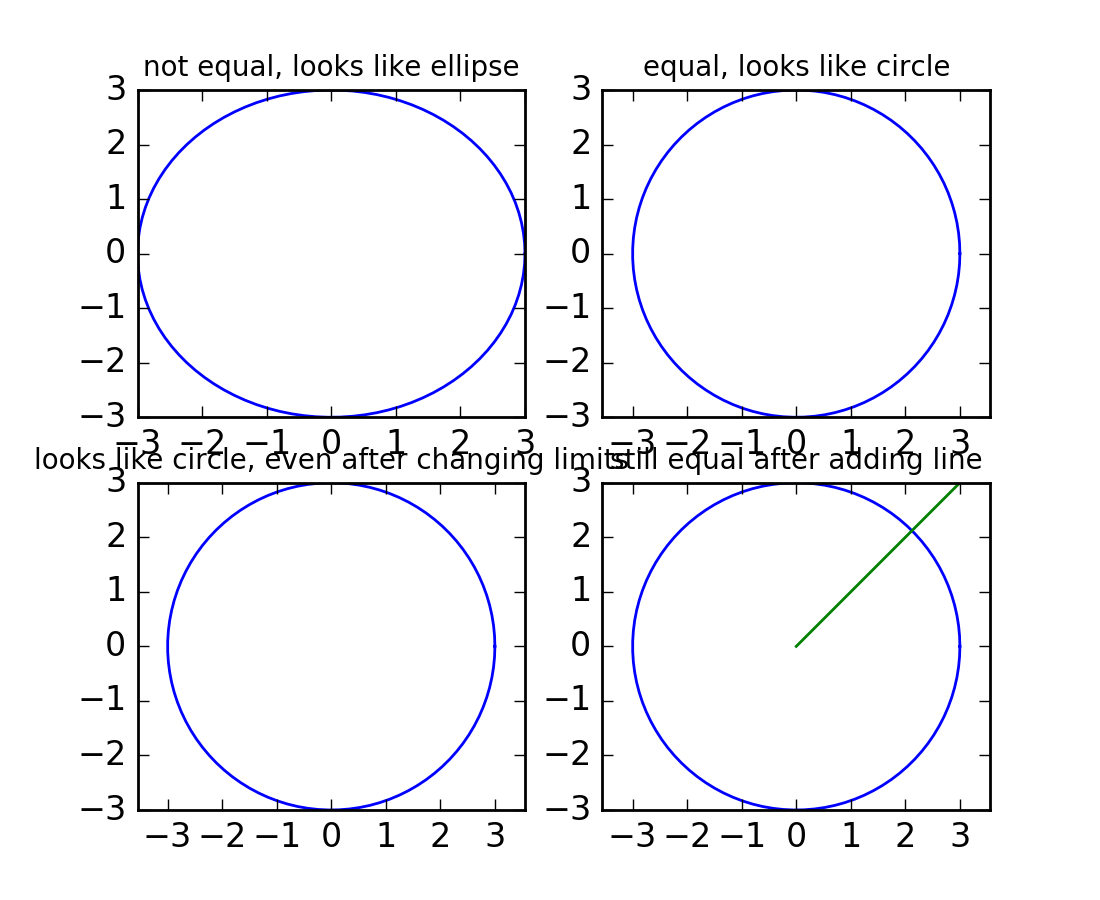
# Plot circle or radius 3
an = np.linspace(0, 2*np.pi, 100)
plt.subplot(221)
plt.plot(3*np.cos(an), 3*np.sin(an))
plt.title('not equal, looks like ellipse', fontsize=10)
plt.subplot(222)
plt.plot(3*np.cos(an), 3*np.sin(an))
plt.axis('equal')
plt.title('equal, looks like circle', fontsize=10)
plt.subplot(223)
plt.plot(3*np.cos(an), 3*np.sin(an))
plt.axis('equal')
plt.axis([-3, 3, -3, 3])
plt.title('looks like circle, even after changing limits', fontsize=10)
plt.subplot(224)
plt.plot(3*np.cos(an), 3*np.sin(an))
plt.axis('equal')
plt.axis([-3, 3, -3, 3])
plt.plot([0, 4], [0, 4])
plt.title('still equal after adding line', fontsize=10)
plt.show()
Keywords: python, matplotlib, pylab, example, codex (see Search examples)