Learn what to expect in the new updates

(Source code, png, hires.png, pdf)
"""
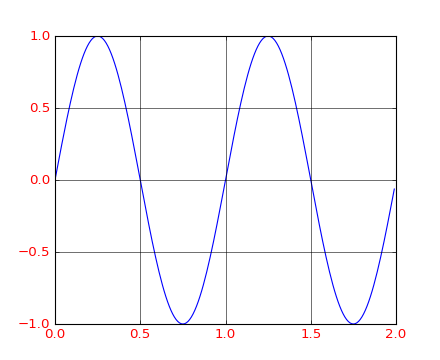
You can control the axis tick and grid properties
"""
import matplotlib.pyplot as plt
import numpy as np
t = np.arange(0.0, 2.0, 0.01)
s = np.sin(2 * np.pi * t)
fig, ax = plt.subplots()
ax.plot(t, s)
ax.grid(True)
ticklines = ax.get_xticklines() + ax.get_yticklines()
gridlines = ax.get_xgridlines() + ax.get_ygridlines()
ticklabels = ax.get_xticklabels() + ax.get_yticklabels()
for line in ticklines:
line.set_linewidth(3)
for line in gridlines:
line.set_linestyle('-')
for label in ticklabels:
label.set_color('r')
label.set_fontsize('medium')
plt.show()
Keywords: python, matplotlib, pylab, example, codex (see Search examples)