Learn what to expect in the new updates

import matplotlib.pyplot as plt
from matplotlib.patches import Ellipse
import numpy as np
if 1:
fig = plt.figure(1, figsize=(8, 5))
ax = fig.add_subplot(111, autoscale_on=False, xlim=(-1, 5), ylim=(-4, 3))
t = np.arange(0.0, 5.0, 0.01)
s = np.cos(2*np.pi*t)
line, = ax.plot(t, s, lw=3, color='purple')
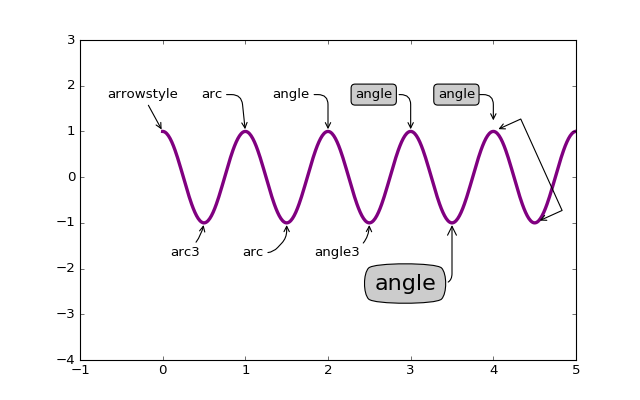
ax.annotate('arrowstyle', xy=(0, 1), xycoords='data',
xytext=(-50, 30), textcoords='offset points',
arrowprops=dict(arrowstyle="->")
)
ax.annotate('arc3', xy=(0.5, -1), xycoords='data',
xytext=(-30, -30), textcoords='offset points',
arrowprops=dict(arrowstyle="->",
connectionstyle="arc3,rad=.2")
)
ax.annotate('arc', xy=(1., 1), xycoords='data',
xytext=(-40, 30), textcoords='offset points',
arrowprops=dict(arrowstyle="->",
connectionstyle="arc,angleA=0,armA=30,rad=10"),
)
ax.annotate('arc', xy=(1.5, -1), xycoords='data',
xytext=(-40, -30), textcoords='offset points',
arrowprops=dict(arrowstyle="->",
connectionstyle="arc,angleA=0,armA=20,angleB=-90,armB=15,rad=7"),
)
ax.annotate('angle', xy=(2., 1), xycoords='data',
xytext=(-50, 30), textcoords='offset points',
arrowprops=dict(arrowstyle="->",
connectionstyle="angle,angleA=0,angleB=90,rad=10"),
)
ax.annotate('angle3', xy=(2.5, -1), xycoords='data',
xytext=(-50, -30), textcoords='offset points',
arrowprops=dict(arrowstyle="->",
connectionstyle="angle3,angleA=0,angleB=-90"),
)
ax.annotate('angle', xy=(3., 1), xycoords='data',
xytext=(-50, 30), textcoords='offset points',
bbox=dict(boxstyle="round", fc="0.8"),
arrowprops=dict(arrowstyle="->",
connectionstyle="angle,angleA=0,angleB=90,rad=10"),
)
ax.annotate('angle', xy=(3.5, -1), xycoords='data',
xytext=(-70, -60), textcoords='offset points',
size=20,
bbox=dict(boxstyle="round4,pad=.5", fc="0.8"),
arrowprops=dict(arrowstyle="->",
connectionstyle="angle,angleA=0,angleB=-90,rad=10"),
)
ax.annotate('angle', xy=(4., 1), xycoords='data',
xytext=(-50, 30), textcoords='offset points',
bbox=dict(boxstyle="round", fc="0.8"),
arrowprops=dict(arrowstyle="->",
shrinkA=0, shrinkB=10,
connectionstyle="angle,angleA=0,angleB=90,rad=10"),
)
ann = ax.annotate('', xy=(4., 1.), xycoords='data',
xytext=(4.5, -1), textcoords='data',
arrowprops=dict(arrowstyle="<->",
connectionstyle="bar",
ec="k",
shrinkA=5, shrinkB=5,
)
)
if 1:
fig = plt.figure(2)
fig.clf()
ax = fig.add_subplot(111, autoscale_on=False, xlim=(-1, 5), ylim=(-5, 3))
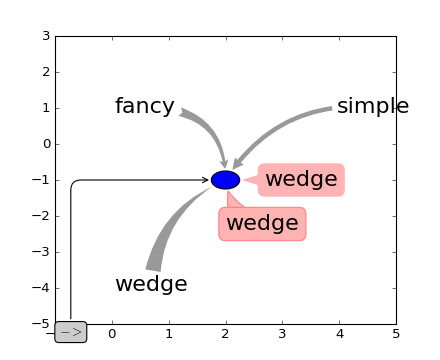
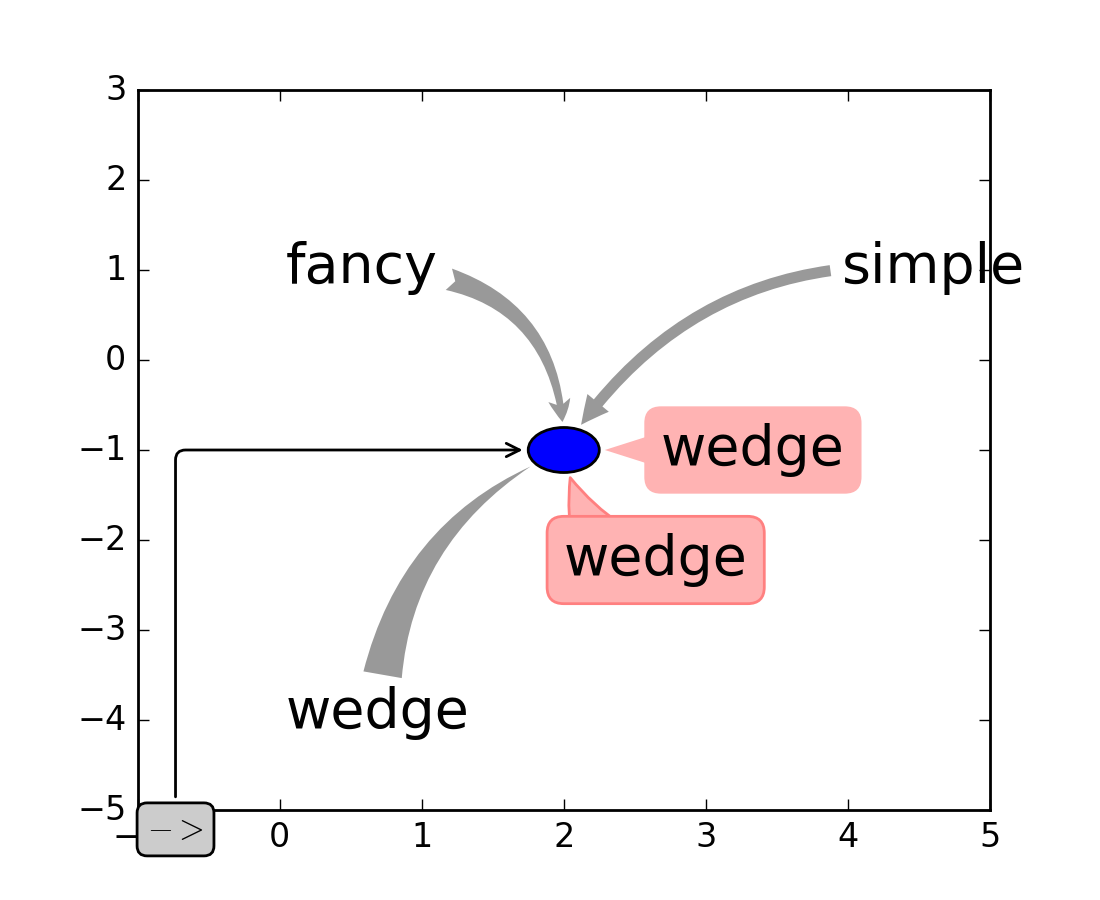
el = Ellipse((2, -1), 0.5, 0.5)
ax.add_patch(el)
ax.annotate('$->$', xy=(2., -1), xycoords='data',
xytext=(-150, -140), textcoords='offset points',
bbox=dict(boxstyle="round", fc="0.8"),
arrowprops=dict(arrowstyle="->",
patchB=el,
connectionstyle="angle,angleA=90,angleB=0,rad=10"),
)
ax.annotate('fancy', xy=(2., -1), xycoords='data',
xytext=(-100, 60), textcoords='offset points',
size=20,
# bbox=dict(boxstyle="round", fc="0.8"),
arrowprops=dict(arrowstyle="fancy",
fc="0.6", ec="none",
patchB=el,
connectionstyle="angle3,angleA=0,angleB=-90"),
)
ax.annotate('simple', xy=(2., -1), xycoords='data',
xytext=(100, 60), textcoords='offset points',
size=20,
# bbox=dict(boxstyle="round", fc="0.8"),
arrowprops=dict(arrowstyle="simple",
fc="0.6", ec="none",
patchB=el,
connectionstyle="arc3,rad=0.3"),
)
ax.annotate('wedge', xy=(2., -1), xycoords='data',
xytext=(-100, -100), textcoords='offset points',
size=20,
# bbox=dict(boxstyle="round", fc="0.8"),
arrowprops=dict(arrowstyle="wedge,tail_width=0.7",
fc="0.6", ec="none",
patchB=el,
connectionstyle="arc3,rad=-0.3"),
)
ann = ax.annotate('wedge', xy=(2., -1), xycoords='data',
xytext=(0, -45), textcoords='offset points',
size=20,
bbox=dict(boxstyle="round", fc=(1.0, 0.7, 0.7), ec=(1., .5, .5)),
arrowprops=dict(arrowstyle="wedge,tail_width=1.",
fc=(1.0, 0.7, 0.7), ec=(1., .5, .5),
patchA=None,
patchB=el,
relpos=(0.2, 0.8),
connectionstyle="arc3,rad=-0.1"),
)
ann = ax.annotate('wedge', xy=(2., -1), xycoords='data',
xytext=(35, 0), textcoords='offset points',
size=20, va="center",
bbox=dict(boxstyle="round", fc=(1.0, 0.7, 0.7), ec="none"),
arrowprops=dict(arrowstyle="wedge,tail_width=1.",
fc=(1.0, 0.7, 0.7), ec="none",
patchA=None,
patchB=el,
relpos=(0.2, 0.5),
)
)
plt.show()
Keywords: python, matplotlib, pylab, example, codex (see Search examples)