Learn what to expect in the new updates

(Source code, png, hires.png, pdf)
"""
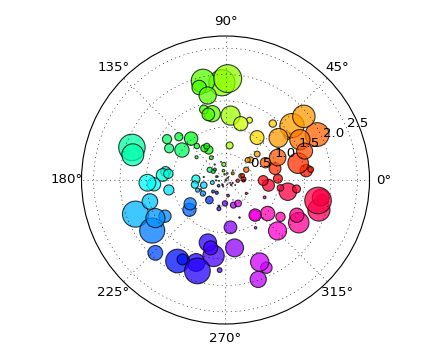
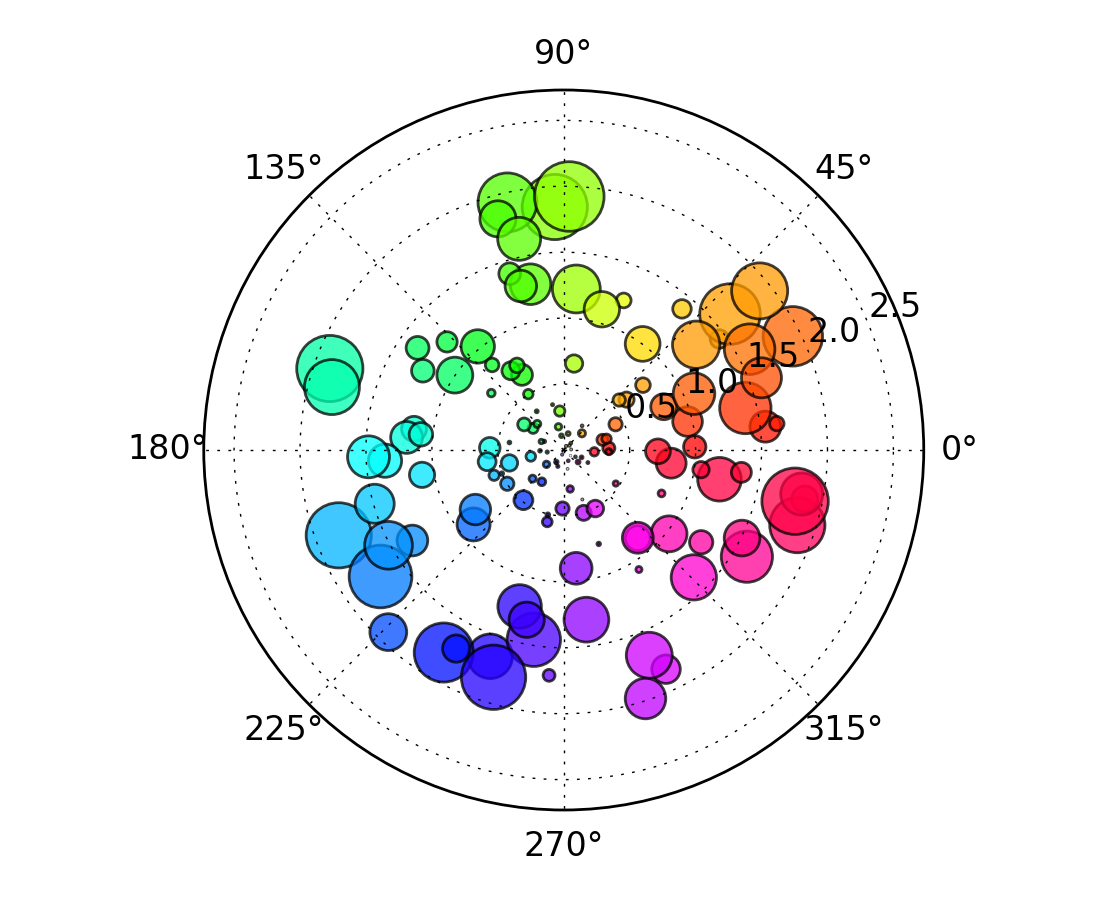
Demo of scatter plot on a polar axis.
Size increases radially in this example and color increases with angle (just to
verify the symbols are being scattered correctly).
"""
import numpy as np
import matplotlib.pyplot as plt
N = 150
r = 2 * np.random.rand(N)
theta = 2 * np.pi * np.random.rand(N)
area = 200 * r**2 * np.random.rand(N)
colors = theta
ax = plt.subplot(111, projection='polar')
c = plt.scatter(theta, r, c=colors, s=area, cmap=plt.cm.hsv)
c.set_alpha(0.75)
plt.show()
Keywords: python, matplotlib, pylab, example, codex (see Search examples)