Learn what to expect in the new updates

(Source code, png, hires.png, pdf)
from mpl_toolkits.mplot3d import axes3d
import matplotlib.pyplot as plt
import numpy as np
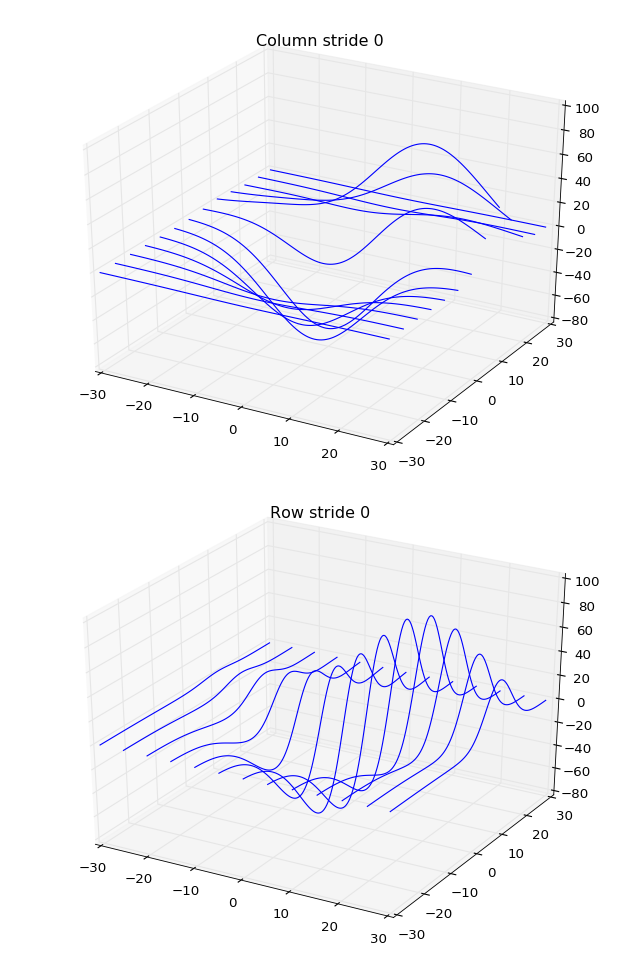
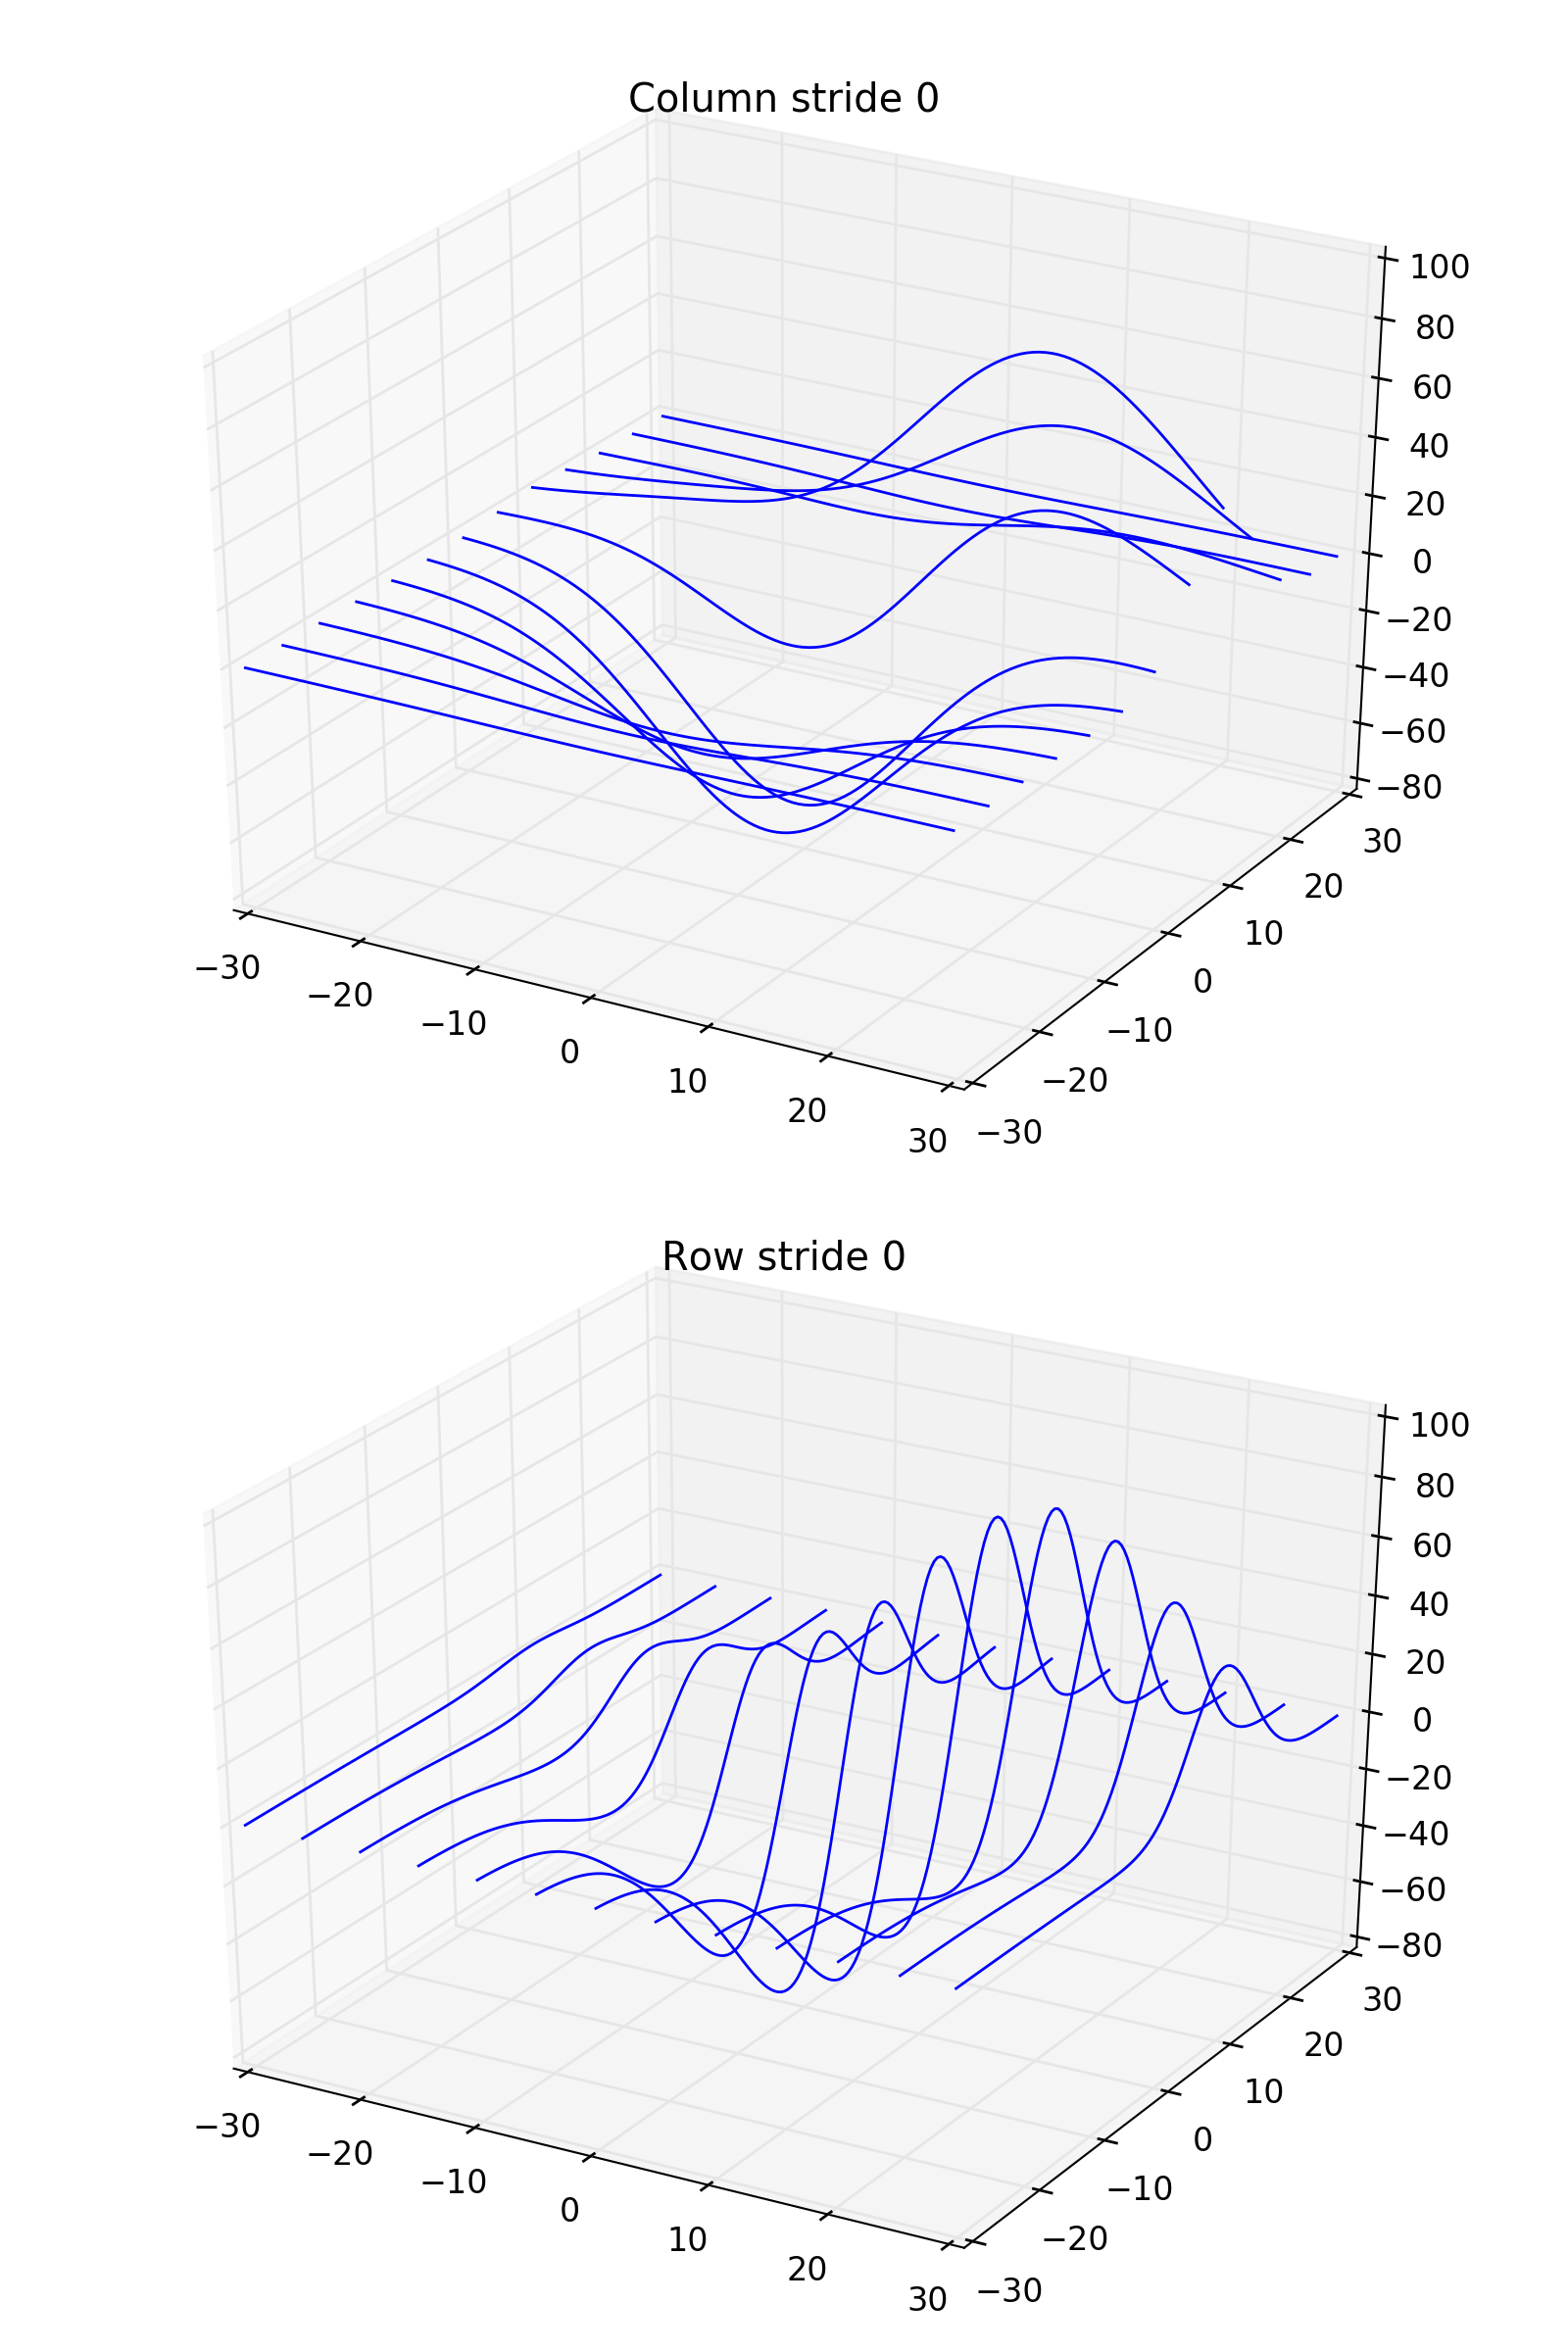
fig, [ax1, ax2] = plt.subplots(2, 1, figsize=(8, 12), subplot_kw={'projection': '3d'})
X, Y, Z = axes3d.get_test_data(0.05)
ax1.plot_wireframe(X, Y, Z, rstride=10, cstride=0)
ax1.set_title("Column stride 0")
ax2.plot_wireframe(X, Y, Z, rstride=0, cstride=10)
ax2.set_title("Row stride 0")
plt.tight_layout()
plt.show()
Keywords: python, matplotlib, pylab, example, codex (see Search examples)