Learn what to expect in the new updates

(Source code, png, hires.png, pdf)
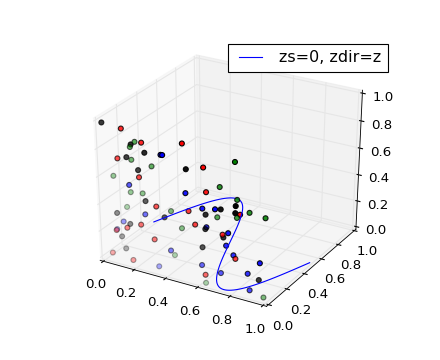
from mpl_toolkits.mplot3d import Axes3D
import numpy as np
import matplotlib.pyplot as plt

fig = plt.figure()
ax = fig.gca(projection='3d')

x = np.linspace(0, 1, 100)
y = np.sin(x * 2 * np.pi) / 2 + 0.5
ax.plot(x, y, zs=0, zdir='z', label='zs=0, zdir=z')

colors = ('r', 'g', 'b', 'k')
for c in colors:
    x = np.random.sample(20)
    y = np.random.sample(20)
    ax.scatter(x, y, 0, zdir='y', c=c)

ax.legend()
ax.set_xlim3d(0, 1)
ax.set_ylim3d(0, 1)
ax.set_zlim3d(0, 1)

plt.show()
Keywords: python, matplotlib, pylab, example, codex (see Search examples)