Learn what to expect in the new updates

(Source code, png, hires.png, pdf)

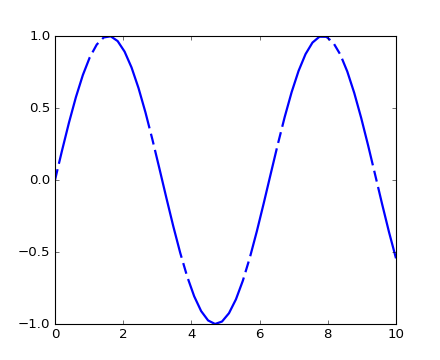
"""
Demo of a simple plot with a custom dashed line.

A Line object's ``set_dashes`` method allows you to specify dashes with
a series of on/off lengths (in points).
"""
import numpy as np
import matplotlib.pyplot as plt


x = np.linspace(0, 10)
line, = plt.plot(x, np.sin(x), '--', linewidth=2)

dashes = [10, 5, 100, 5]  # 10 points on, 5 off, 100 on, 5 off
line.set_dashes(dashes)

plt.show()
Keywords: python, matplotlib, pylab, example, codex (see Search examples)