Learn what to expect in the new updates

(Source code, png, hires.png, pdf)

"""
Demo of the new boxplot drawer function
"""
import numpy as np
import matplotlib.pyplot as plt
import matplotlib.cbook as cbook
# fake data
np.random.seed(937)
data = np.random.lognormal(size=(37, 4), mean=1.5, sigma=1.75)
labels = list('ABCD')
# compute the boxplot stats
stats = cbook.boxplot_stats(data, labels=labels, bootstrap=10000)
# After we've computed the stats, we can go through and change anything.
# Just to prove it, I'll set the median of each set to the median of all
# the data, and double the means
for n in range(len(stats)):
stats[n]['med'] = np.median(data)
stats[n]['mean'] *= 2
print(stats[0].keys())
fs = 10 # fontsize
# demonstrate how to toggle the display of different elements:
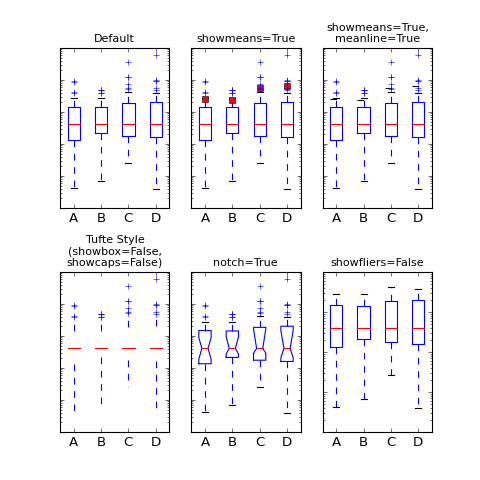
fig, axes = plt.subplots(nrows=2, ncols=3, figsize=(6,6))
axes[0, 0].bxp(stats)
axes[0, 0].set_title('Default', fontsize=fs)
axes[0, 1].bxp(stats, showmeans=True)
axes[0, 1].set_title('showmeans=True', fontsize=fs)
axes[0, 2].bxp(stats, showmeans=True, meanline=True)
axes[0, 2].set_title('showmeans=True,\nmeanline=True', fontsize=fs)
axes[1, 0].bxp(stats, showbox=False, showcaps=False)
axes[1, 0].set_title('Tufte Style\n(showbox=False,\nshowcaps=False)', fontsize=fs)
axes[1, 1].bxp(stats, shownotches=True)
axes[1, 1].set_title('notch=True', fontsize=fs)
axes[1, 2].bxp(stats, showfliers=False)
axes[1, 2].set_title('showfliers=False', fontsize=fs)
for ax in axes.flatten():
ax.set_yscale('log')
ax.set_yticklabels([])
fig.subplots_adjust(hspace=0.4)
plt.show()
# demonstrate how to customize the display different elements:
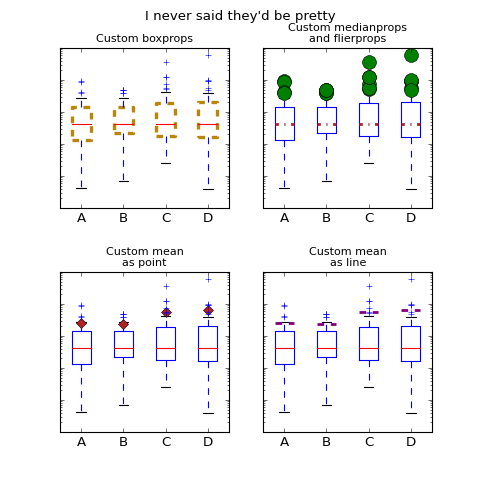
boxprops = dict(linestyle='--', linewidth=3, color='darkgoldenrod')
flierprops = dict(marker='o', markerfacecolor='green', markersize=12,
linestyle='none')
medianprops = dict(linestyle='-.', linewidth=2.5, color='firebrick')
meanpointprops = dict(marker='D', markeredgecolor='black',
markerfacecolor='firebrick')
meanlineprops = dict(linestyle='--', linewidth=2.5, color='purple')
fig, axes = plt.subplots(nrows=2, ncols=2, figsize=(6,6))
axes[0, 0].bxp(stats, boxprops=boxprops)
axes[0, 0].set_title('Custom boxprops', fontsize=fs)
axes[0, 1].bxp(stats, flierprops=flierprops, medianprops=medianprops)
axes[0, 1].set_title('Custom medianprops\nand flierprops', fontsize=fs)
axes[1, 0].bxp(stats, meanprops=meanpointprops, meanline=False,
showmeans=True)
axes[1, 0].set_title('Custom mean\nas point', fontsize=fs)
axes[1, 1].bxp(stats, meanprops=meanlineprops, meanline=True, showmeans=True)
axes[1, 1].set_title('Custom mean\nas line', fontsize=fs)
for ax in axes.flatten():
ax.set_yscale('log')
ax.set_yticklabels([])
fig.suptitle("I never said they'd be pretty")
fig.subplots_adjust(hspace=0.4)
plt.show()
Keywords: python, matplotlib, pylab, example, codex (see Search examples)