Learn what to expect in the new updates

(Source code, png, hires.png, pdf)

"""
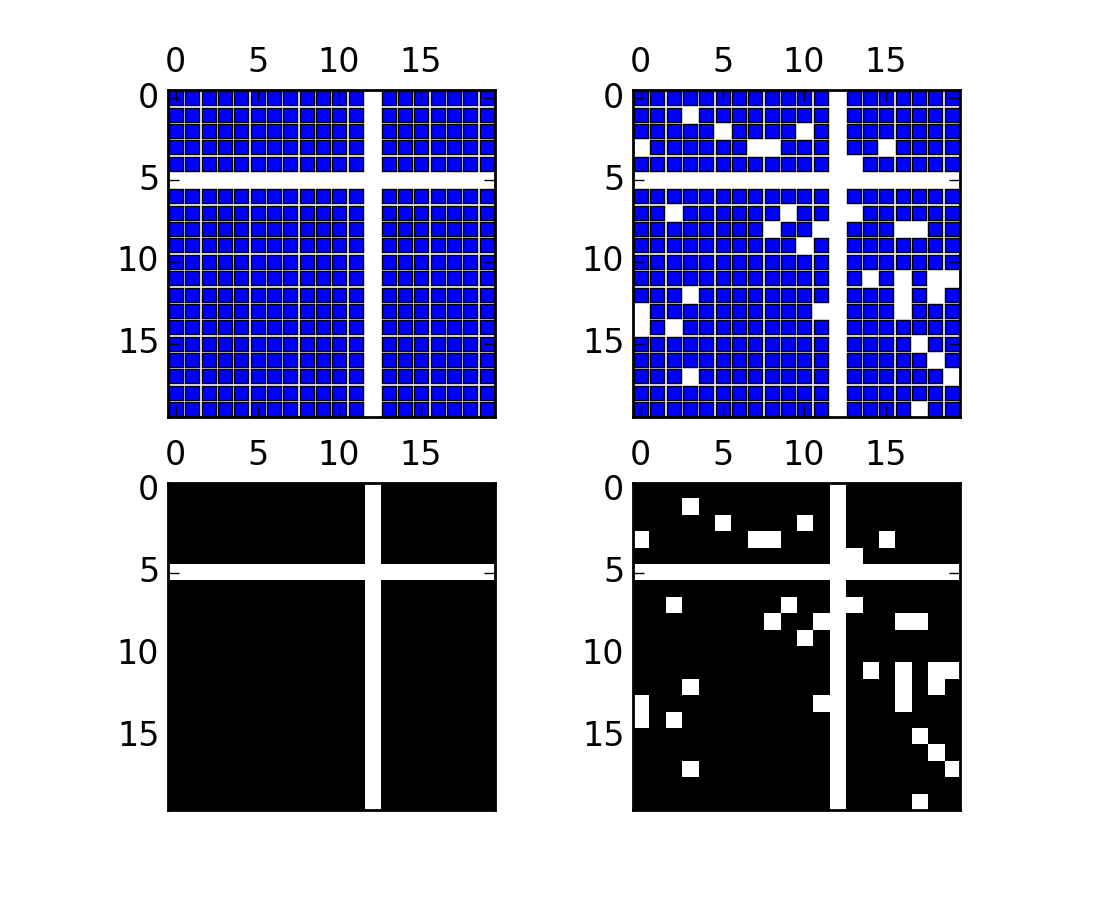
Plot the sparsity pattern of arrays
"""
from matplotlib.pyplot import figure, show
import numpy
fig = figure()
ax1 = fig.add_subplot(221)
ax2 = fig.add_subplot(222)
ax3 = fig.add_subplot(223)
ax4 = fig.add_subplot(224)
x = numpy.random.randn(20,20)
x[5] = 0.
x[:,12] = 0.
ax1.spy(x, markersize=5)
ax2.spy(x, precision=0.1, markersize=5)
ax3.spy(x)
ax4.spy(x, precision=0.1)
show()
Keywords: python, matplotlib, pylab, example, codex (see Search examples)