Learn what to expect in the new updates

'''
Demonstration of quiver and quiverkey functions. This is using the
new version coming from the code in quiver.py.
Known problem: the plot autoscaling does not take into account
the arrows, so those on the boundaries are often out of the picture.
This is *not* an easy problem to solve in a perfectly general way.
The workaround is to manually expand the axes.
'''
from pylab import *
from numpy import ma
X,Y = meshgrid( arange(0,2*pi,.2),arange(0,2*pi,.2) )
U = cos(X)
V = sin(Y)
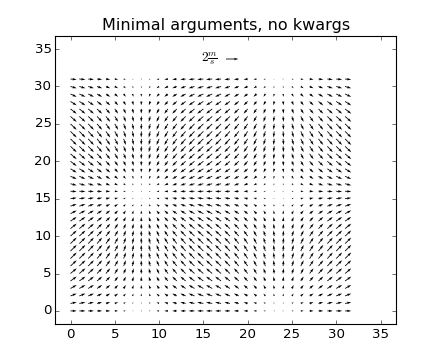
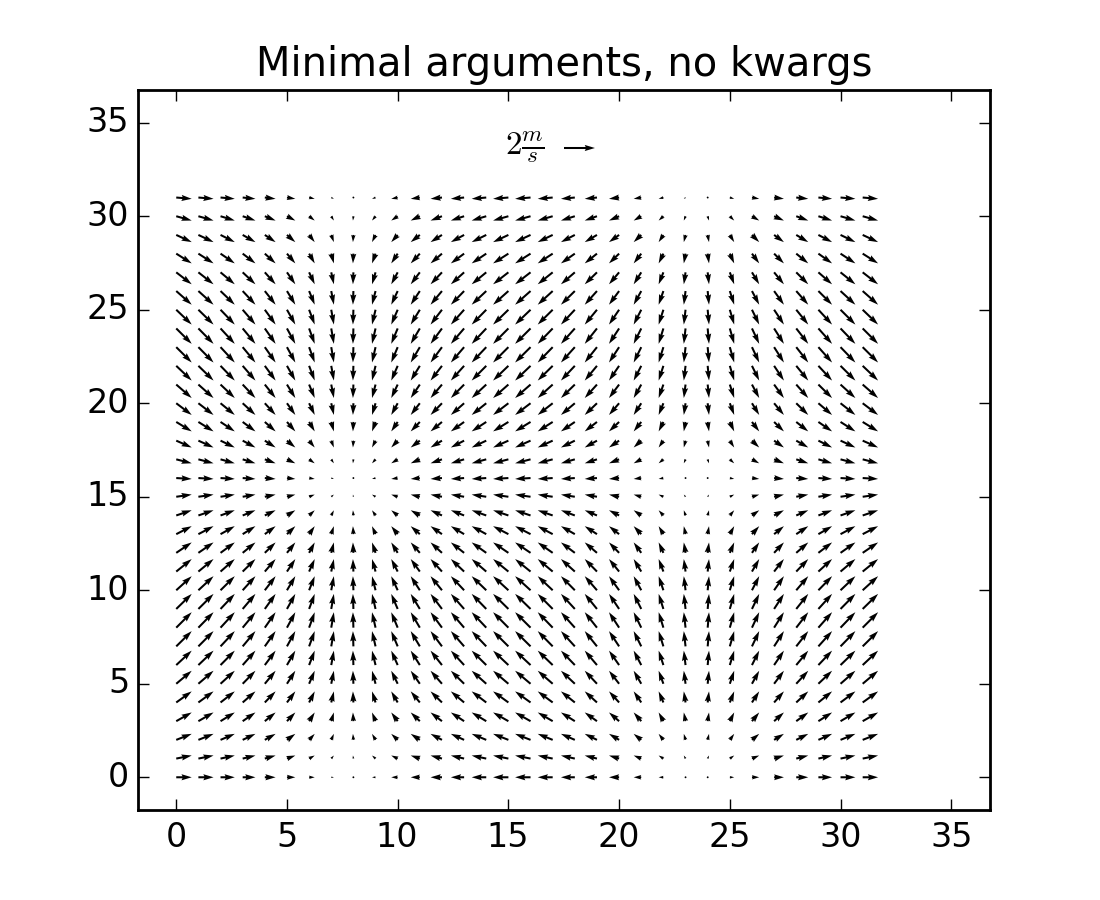
#1
figure()
Q = quiver( U, V)
qk = quiverkey(Q, 0.5, 0.92, 2, r'$2 \frac{m}{s}$', labelpos='W',
fontproperties={'weight': 'bold'})
l,r,b,t = axis()
dx, dy = r-l, t-b
axis([l-0.05*dx, r+0.05*dx, b-0.05*dy, t+0.05*dy])
title('Minimal arguments, no kwargs')
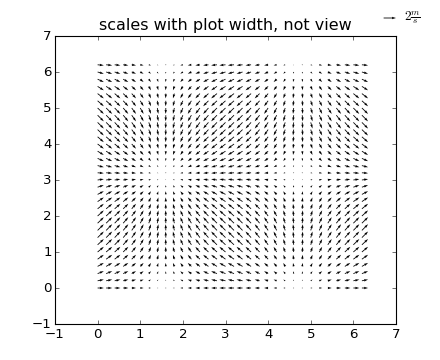
#2
figure()
Q = quiver( X, Y, U, V, units='width')
qk = quiverkey(Q, 0.9, 0.95, 2, r'$2 \frac{m}{s}$',
labelpos='E',
coordinates='figure',
fontproperties={'weight': 'bold'})
axis([-1, 7, -1, 7])
title('scales with plot width, not view')
#3
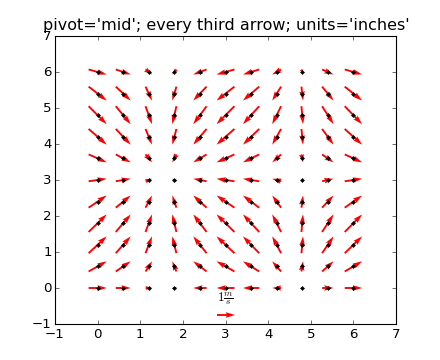
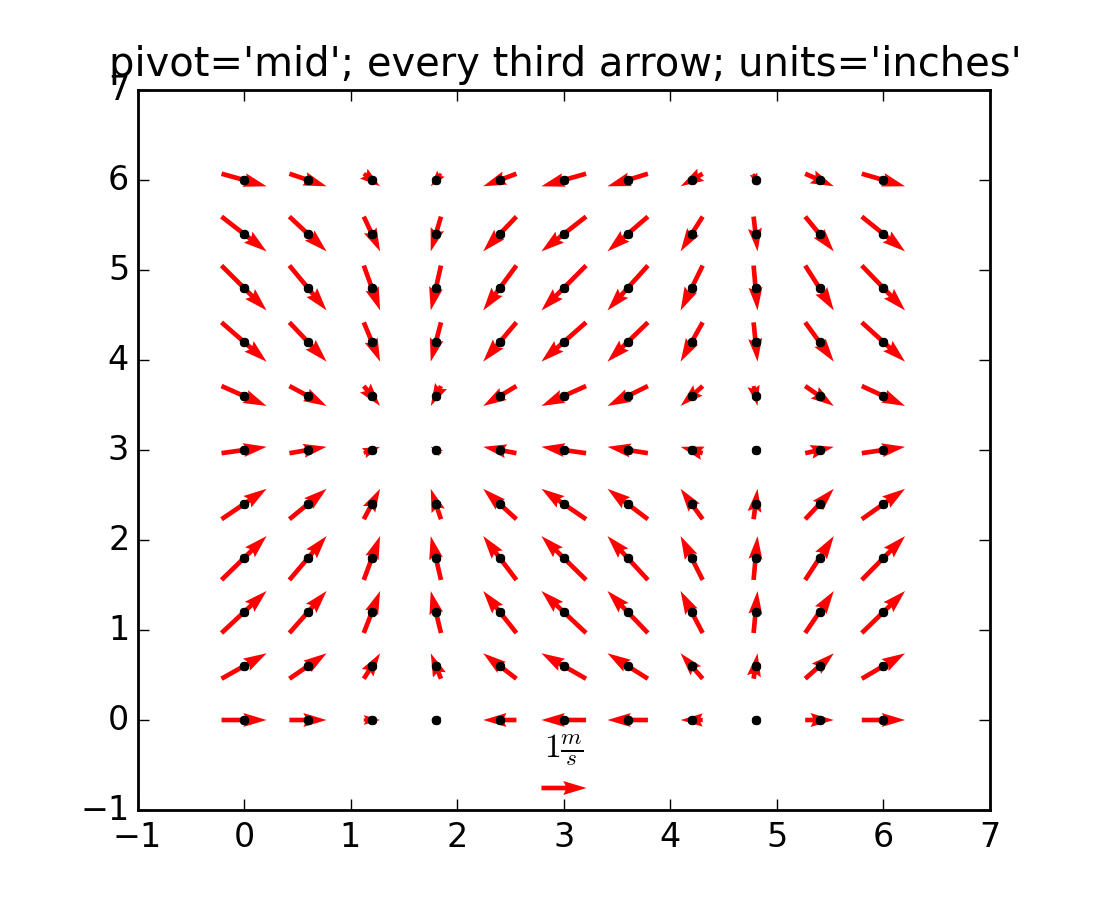
figure()
Q = quiver( X[::3, ::3], Y[::3, ::3], U[::3, ::3], V[::3, ::3],
pivot='mid', color='r', units='inches' )
qk = quiverkey(Q, 0.5, 0.03, 1, r'$1 \frac{m}{s}$', fontproperties={'weight': 'bold'})
plot( X[::3, ::3], Y[::3, ::3], 'k.')
axis([-1, 7, -1, 7])
title("pivot='mid'; every third arrow; units='inches'")
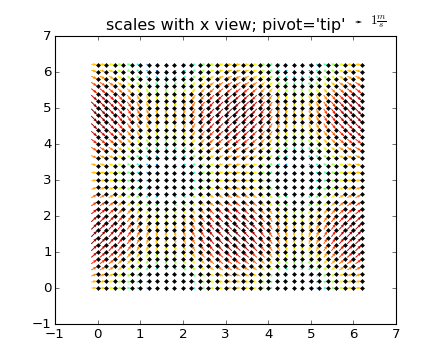
#4
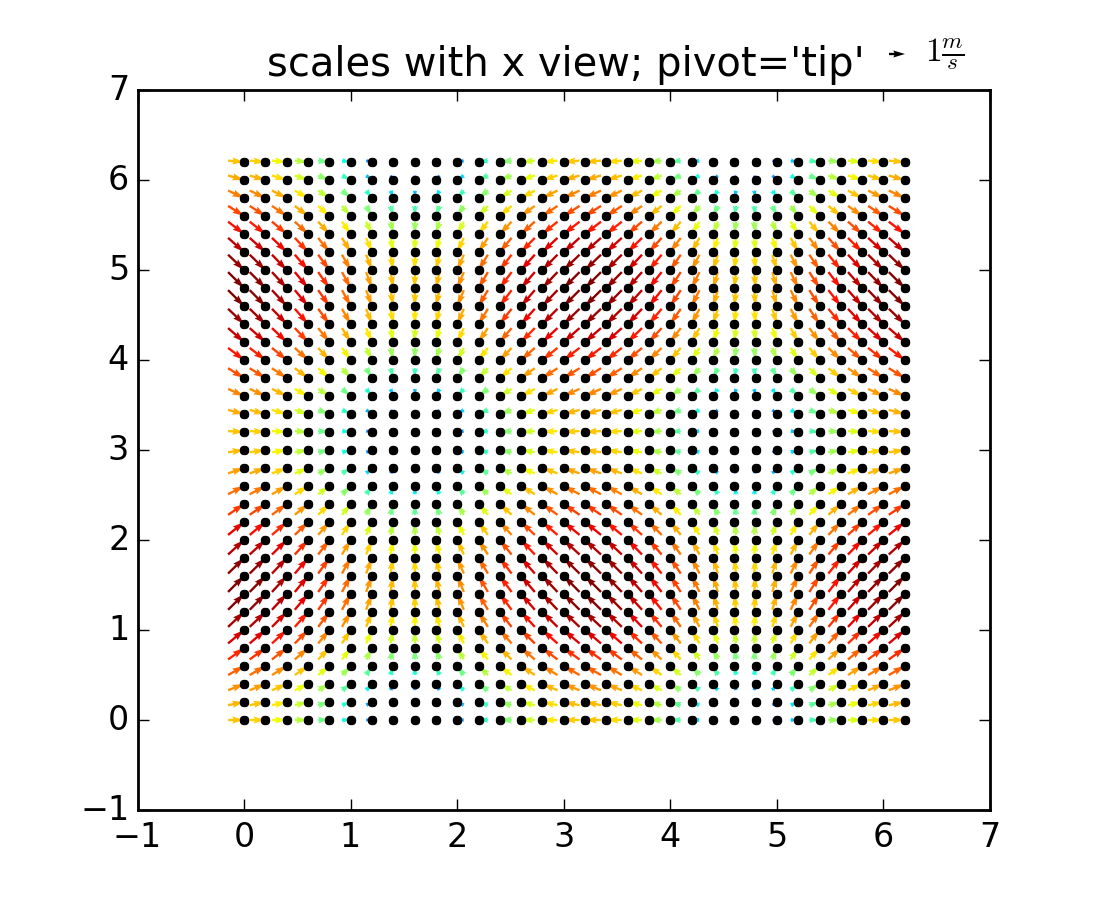
figure()
M = sqrt(pow(U, 2) + pow(V, 2))
Q = quiver( X, Y, U, V, M, units='x', pivot='tip', width=0.022, scale=1/0.15)
qk = quiverkey(Q, 0.9, 1.05, 1, r'$1 \frac{m}{s}$',
labelpos='E',
fontproperties={'weight': 'bold'})
plot(X, Y, 'k.')
axis([-1, 7, -1, 7])
title("scales with x view; pivot='tip'")
#5
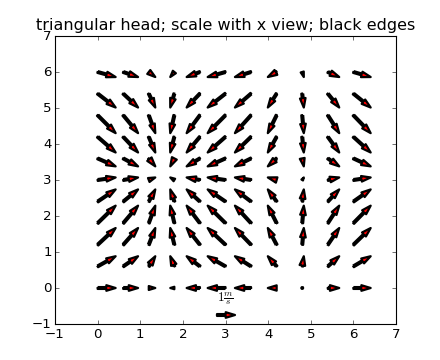
figure()
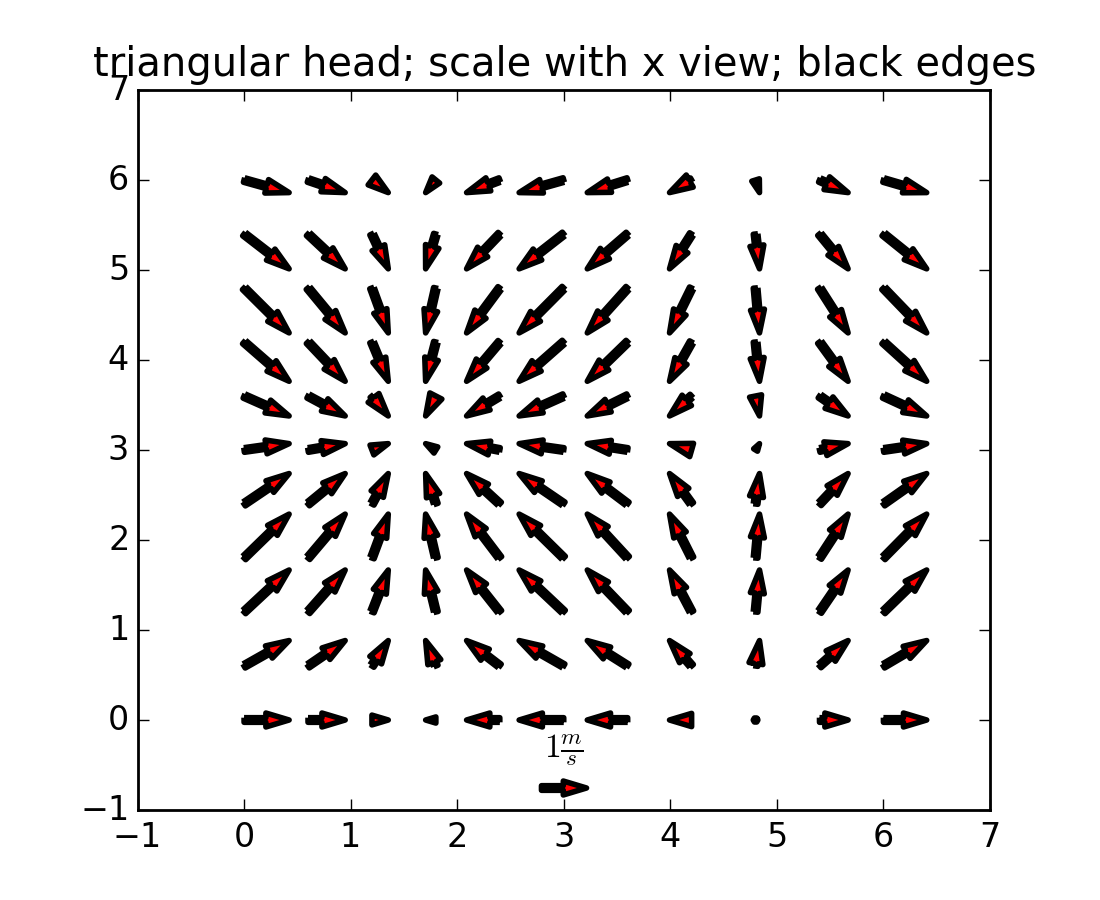
Q = quiver( X[::3, ::3], Y[::3, ::3], U[::3, ::3], V[::3, ::3],
color='r', units='x',
linewidths=(2,), edgecolors=('k'), headaxislength=5 )
qk = quiverkey(Q, 0.5, 0.03, 1, r'$1 \frac{m}{s}$', fontproperties={'weight': 'bold'})
axis([-1, 7, -1, 7])
title("triangular head; scale with x view; black edges")
#6
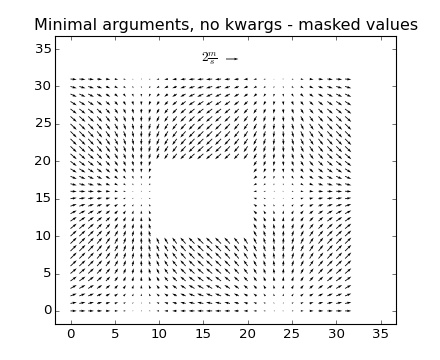
figure()
M = zeros(U.shape, dtype='bool')
M[U.shape[0]/3:2*U.shape[0]/3,U.shape[1]/3:2*U.shape[1]/3] = True
U = ma.masked_array(U, mask=M)
V = ma.masked_array(V, mask=M)
Q = quiver( U, V)
qk = quiverkey(Q, 0.5, 0.92, 2, r'$2 \frac{m}{s}$', labelpos='W',
fontproperties={'weight': 'bold'})
l,r,b,t = axis()
dx, dy = r-l, t-b
axis([l-0.05*dx, r+0.05*dx, b-0.05*dy, t+0.05*dy])
title('Minimal arguments, no kwargs - masked values')
show()
Keywords: python, matplotlib, pylab, example, codex (see Search examples)


