Learn what to expect in the new updates

'''
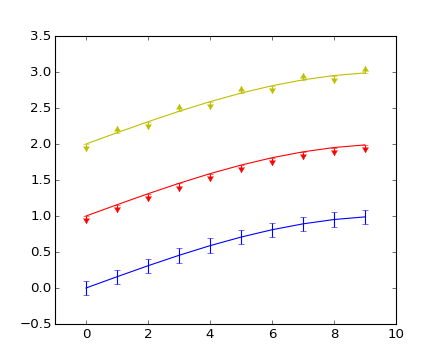
Illustration of upper and lower limit symbols on errorbars
'''
from math import pi
from numpy import array, arange, sin
import pylab as P
fig = P.figure()
x = arange(10.0)
y = sin(arange(10.0)/20.0*pi)
P.errorbar(x,y,yerr=0.1,capsize=3)
y = sin(arange(10.0)/20.0*pi) + 1
P.errorbar(x,y,yerr=0.1, uplims=True)
y = sin(arange(10.0)/20.0*pi) + 2
upperlimits = array([1,0]*5)
lowerlimits = array([0,1]*5)
P.errorbar(x, y, yerr=0.1, uplims=upperlimits, lolims=lowerlimits)
P.xlim(-1,10)
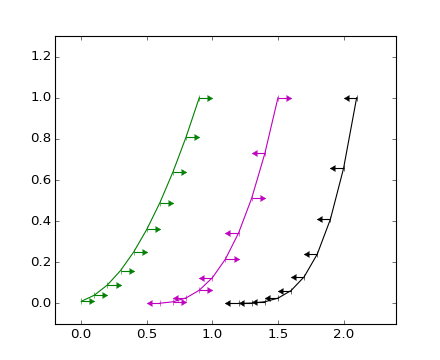
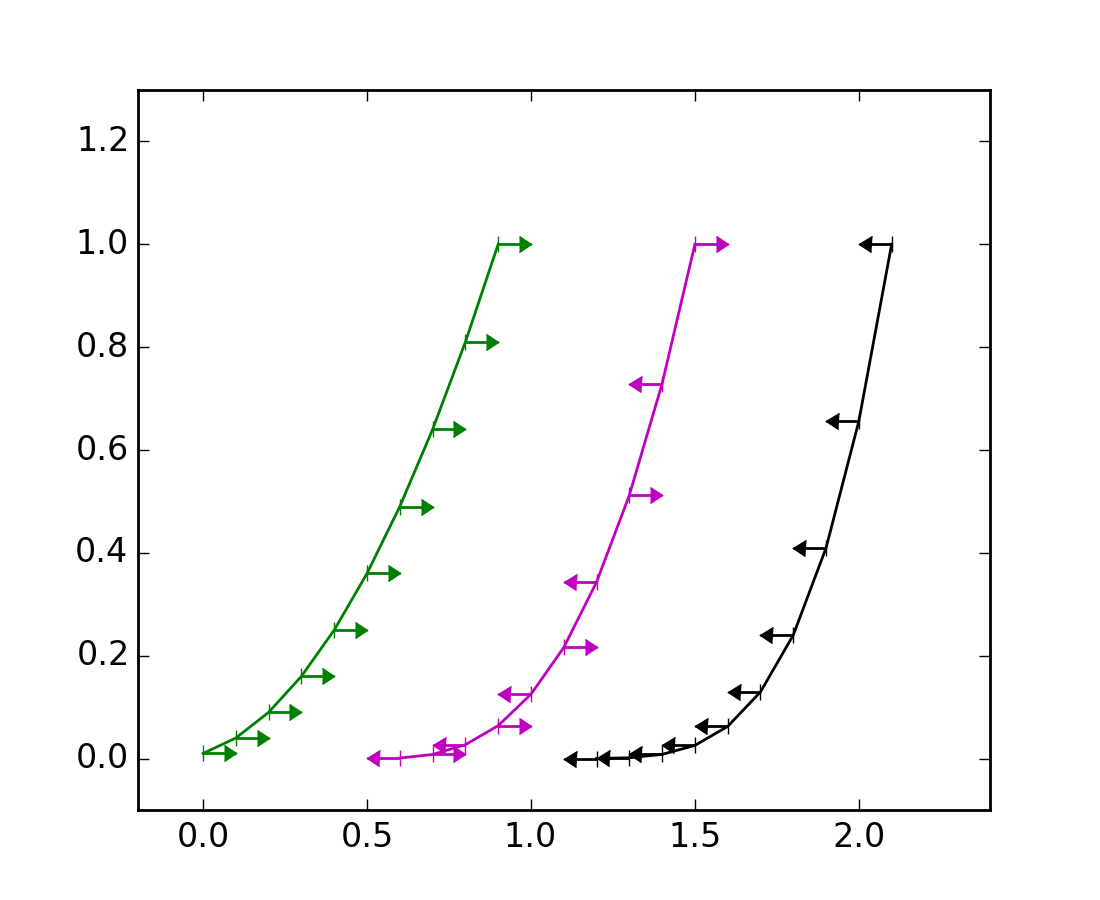
fig = P.figure()
x = arange(10.0)/10.0
y = (x+0.1)**2
P.errorbar(x, y, xerr=0.1, xlolims=True)
y = (x+0.1)**3
P.errorbar(x+0.6, y, xerr=0.1, xuplims=upperlimits, xlolims=lowerlimits)
y = (x+0.1)**4
P.errorbar(x+1.2, y, xerr=0.1, xuplims=True)
P.xlim(-0.2,2.4)
P.ylim(-0.1,1.3)
P.show()
Keywords: python, matplotlib, pylab, example, codex (see Search examples)