Learn what to expect in the new updates

"""Produce custom labelling for a colorbar.
Contributed by Scott Sinclair
"""
import matplotlib.pyplot as plt
import numpy as np
from matplotlib import cm
from numpy.random import randn
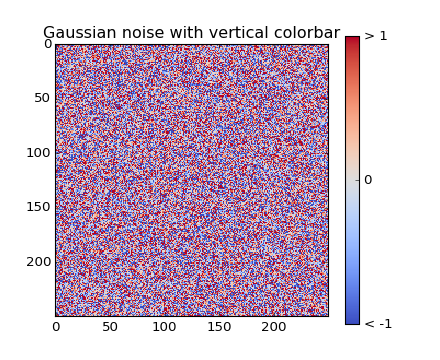
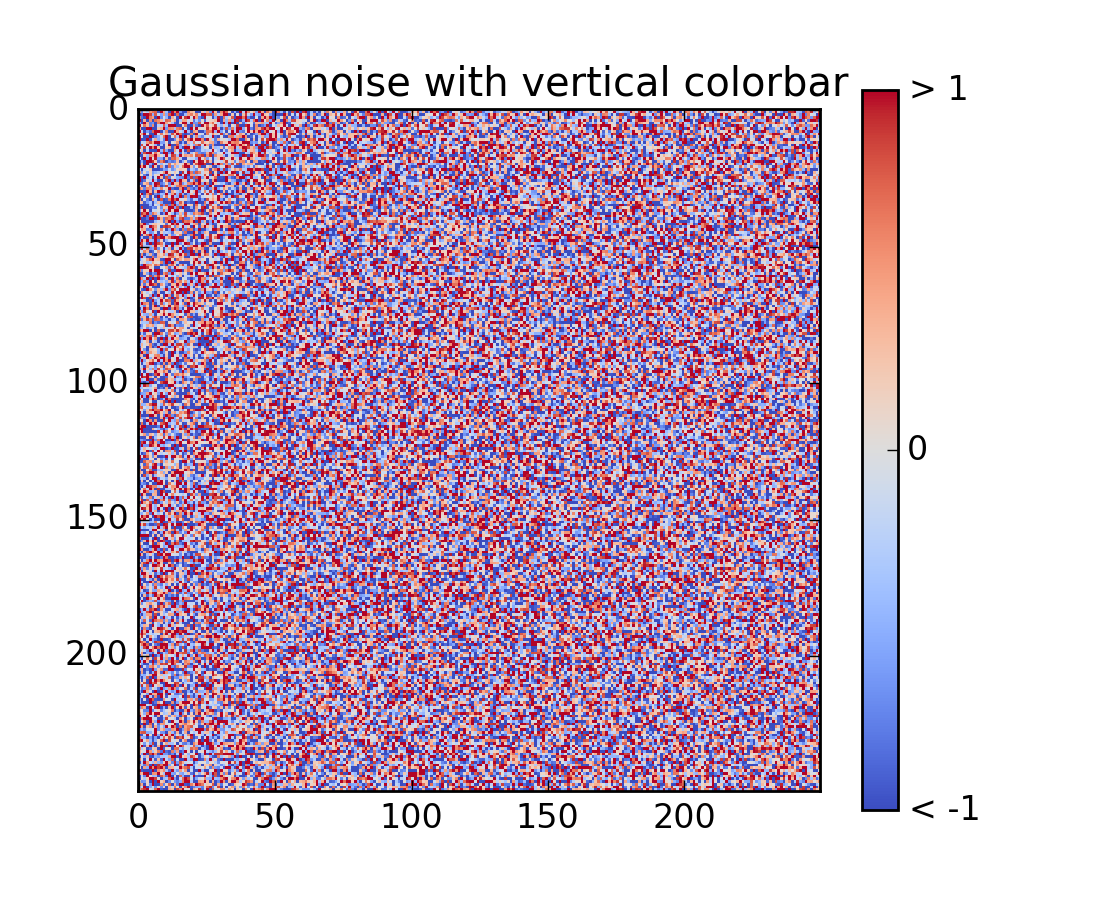
# Make plot with vertical (default) colorbar
fig, ax = plt.subplots()
data = np.clip(randn(250, 250), -1, 1)
cax = ax.imshow(data, interpolation='nearest', cmap=cm.coolwarm)
ax.set_title('Gaussian noise with vertical colorbar')
# Add colorbar, make sure to specify tick locations to match desired ticklabels
cbar = fig.colorbar(cax, ticks=[-1, 0, 1])
cbar.ax.set_yticklabels(['< -1', '0', '> 1'])# vertically oriented colorbar
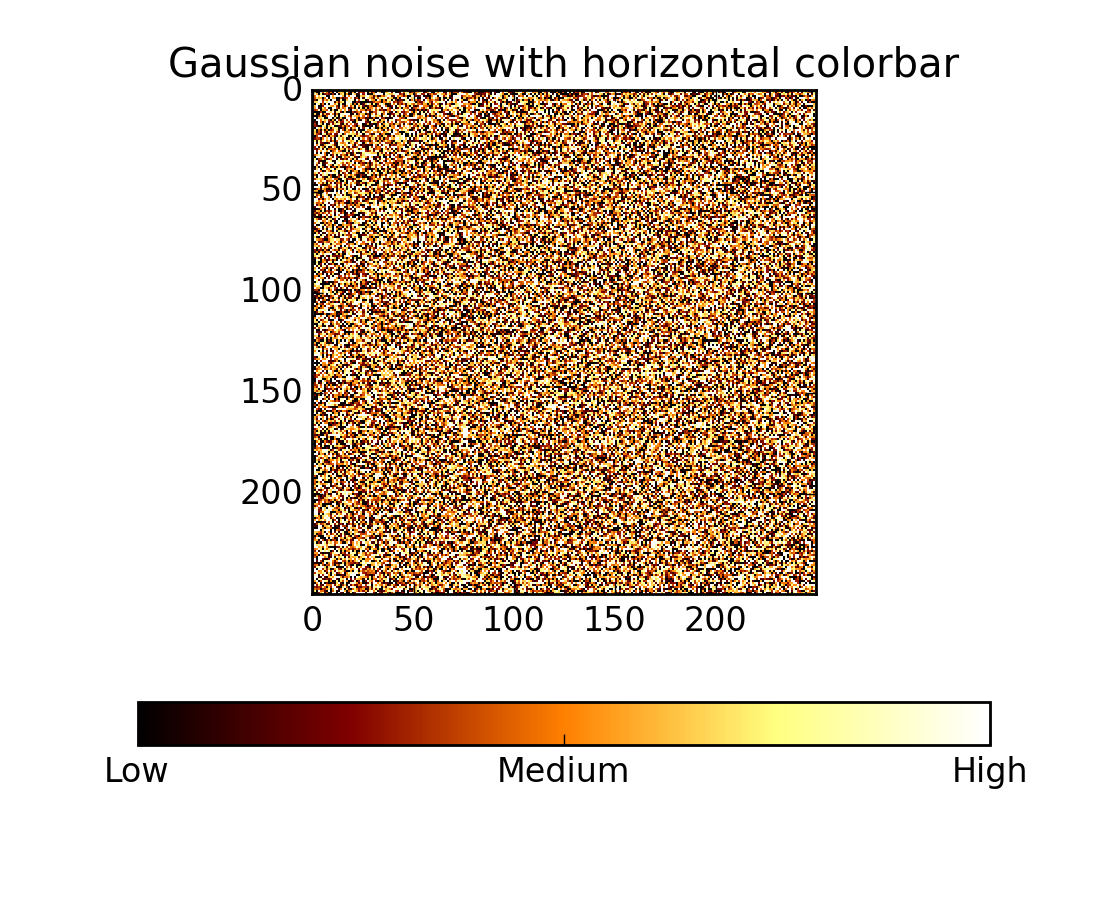
# Make plot with horizontal colorbar
fig, ax = plt.subplots()
data = np.clip(randn(250, 250), -1, 1)
cax = ax.imshow(data, interpolation='nearest', cmap=cm.afmhot)
ax.set_title('Gaussian noise with horizontal colorbar')
cbar = fig.colorbar(cax, ticks=[-1, 0, 1], orientation='horizontal')
cbar.ax.set_xticklabels(['Low', 'Medium', 'High'])# horizontal colorbar
plt.show()
Keywords: python, matplotlib, pylab, example, codex (see Search examples)

