Learn what to expect in the new updates

(Source code, png, hires.png, pdf)

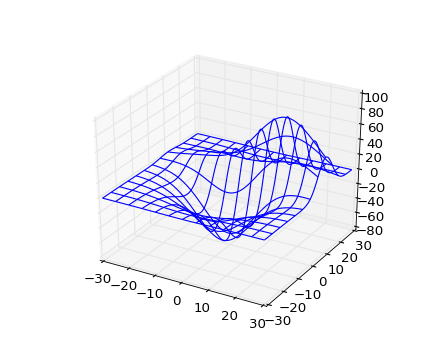
from mpl_toolkits.mplot3d import axes3d
import matplotlib.pyplot as plt
import numpy as np

fig = plt.figure()
ax = fig.add_subplot(111, projection='3d')
X, Y, Z = axes3d.get_test_data(0.05)
ax.plot_wireframe(X, Y, Z, rstride=10, cstride=10)

plt.show()
Keywords: python, matplotlib, pylab, example, codex (see Search examples)