Learn what to expect in the new updates

(Source code, png, hires.png, pdf)
"""
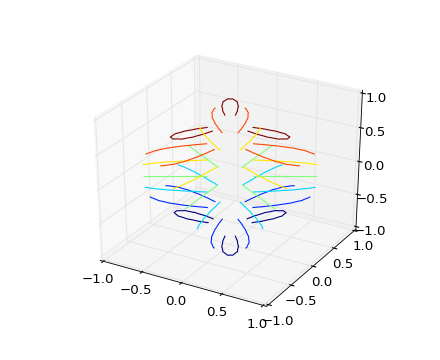
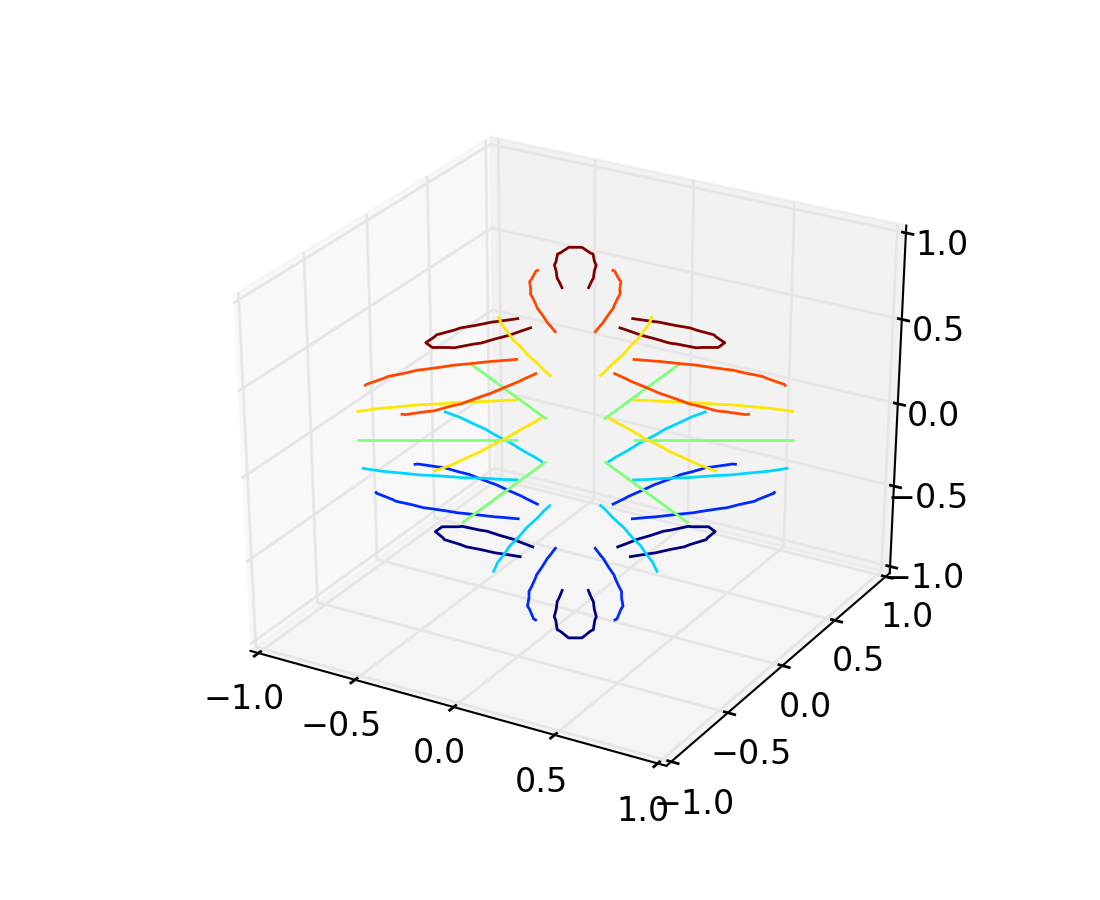
Contour plots of unstructured triangular grids.
"""
import matplotlib.pyplot as plt
from mpl_toolkits.mplot3d import Axes3D
import matplotlib.tri as tri
import numpy as np
import math
# First create the x and y coordinates of the points.
n_angles = 48
n_radii = 8
min_radius = 0.25
radii = np.linspace(min_radius, 0.95, n_radii)
angles = np.linspace(0, 2*math.pi, n_angles, endpoint=False)
angles = np.repeat(angles[...,np.newaxis], n_radii, axis=1)
angles[:,1::2] += math.pi/n_angles
x = (radii*np.cos(angles)).flatten()
y = (radii*np.sin(angles)).flatten()
z = (np.cos(radii)*np.cos(angles*3.0)).flatten()
# Create a custom triangulation
triang = tri.Triangulation(x, y)
# Mask off unwanted triangles.
xmid = x[triang.triangles].mean(axis=1)
ymid = y[triang.triangles].mean(axis=1)
mask = np.where(xmid*xmid + ymid*ymid < min_radius*min_radius, 1, 0)
triang.set_mask(mask)
plt.figure()
plt.gca(projection='3d')
plt.tricontour(triang, z)
plt.show()
Keywords: python, matplotlib, pylab, example, codex (see Search examples)