Learn what to expect in the new updates

(Source code, png, hires.png, pdf)
'''
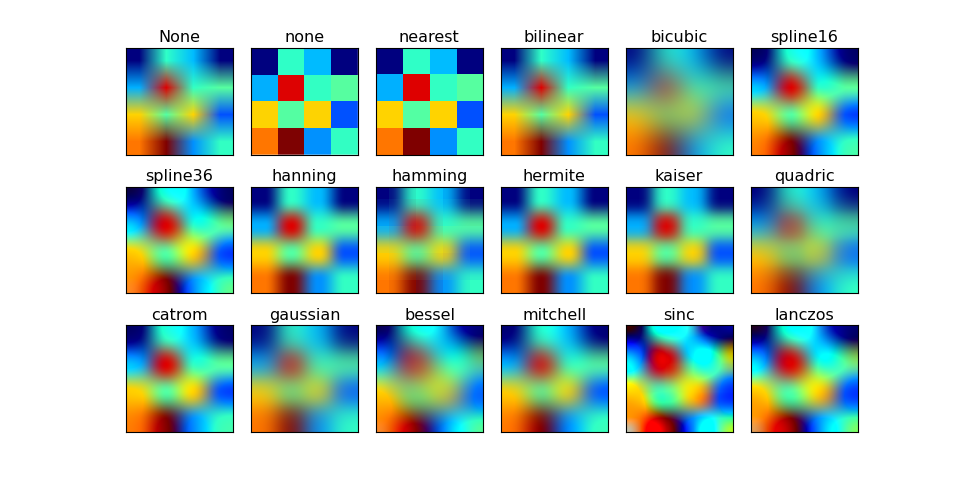
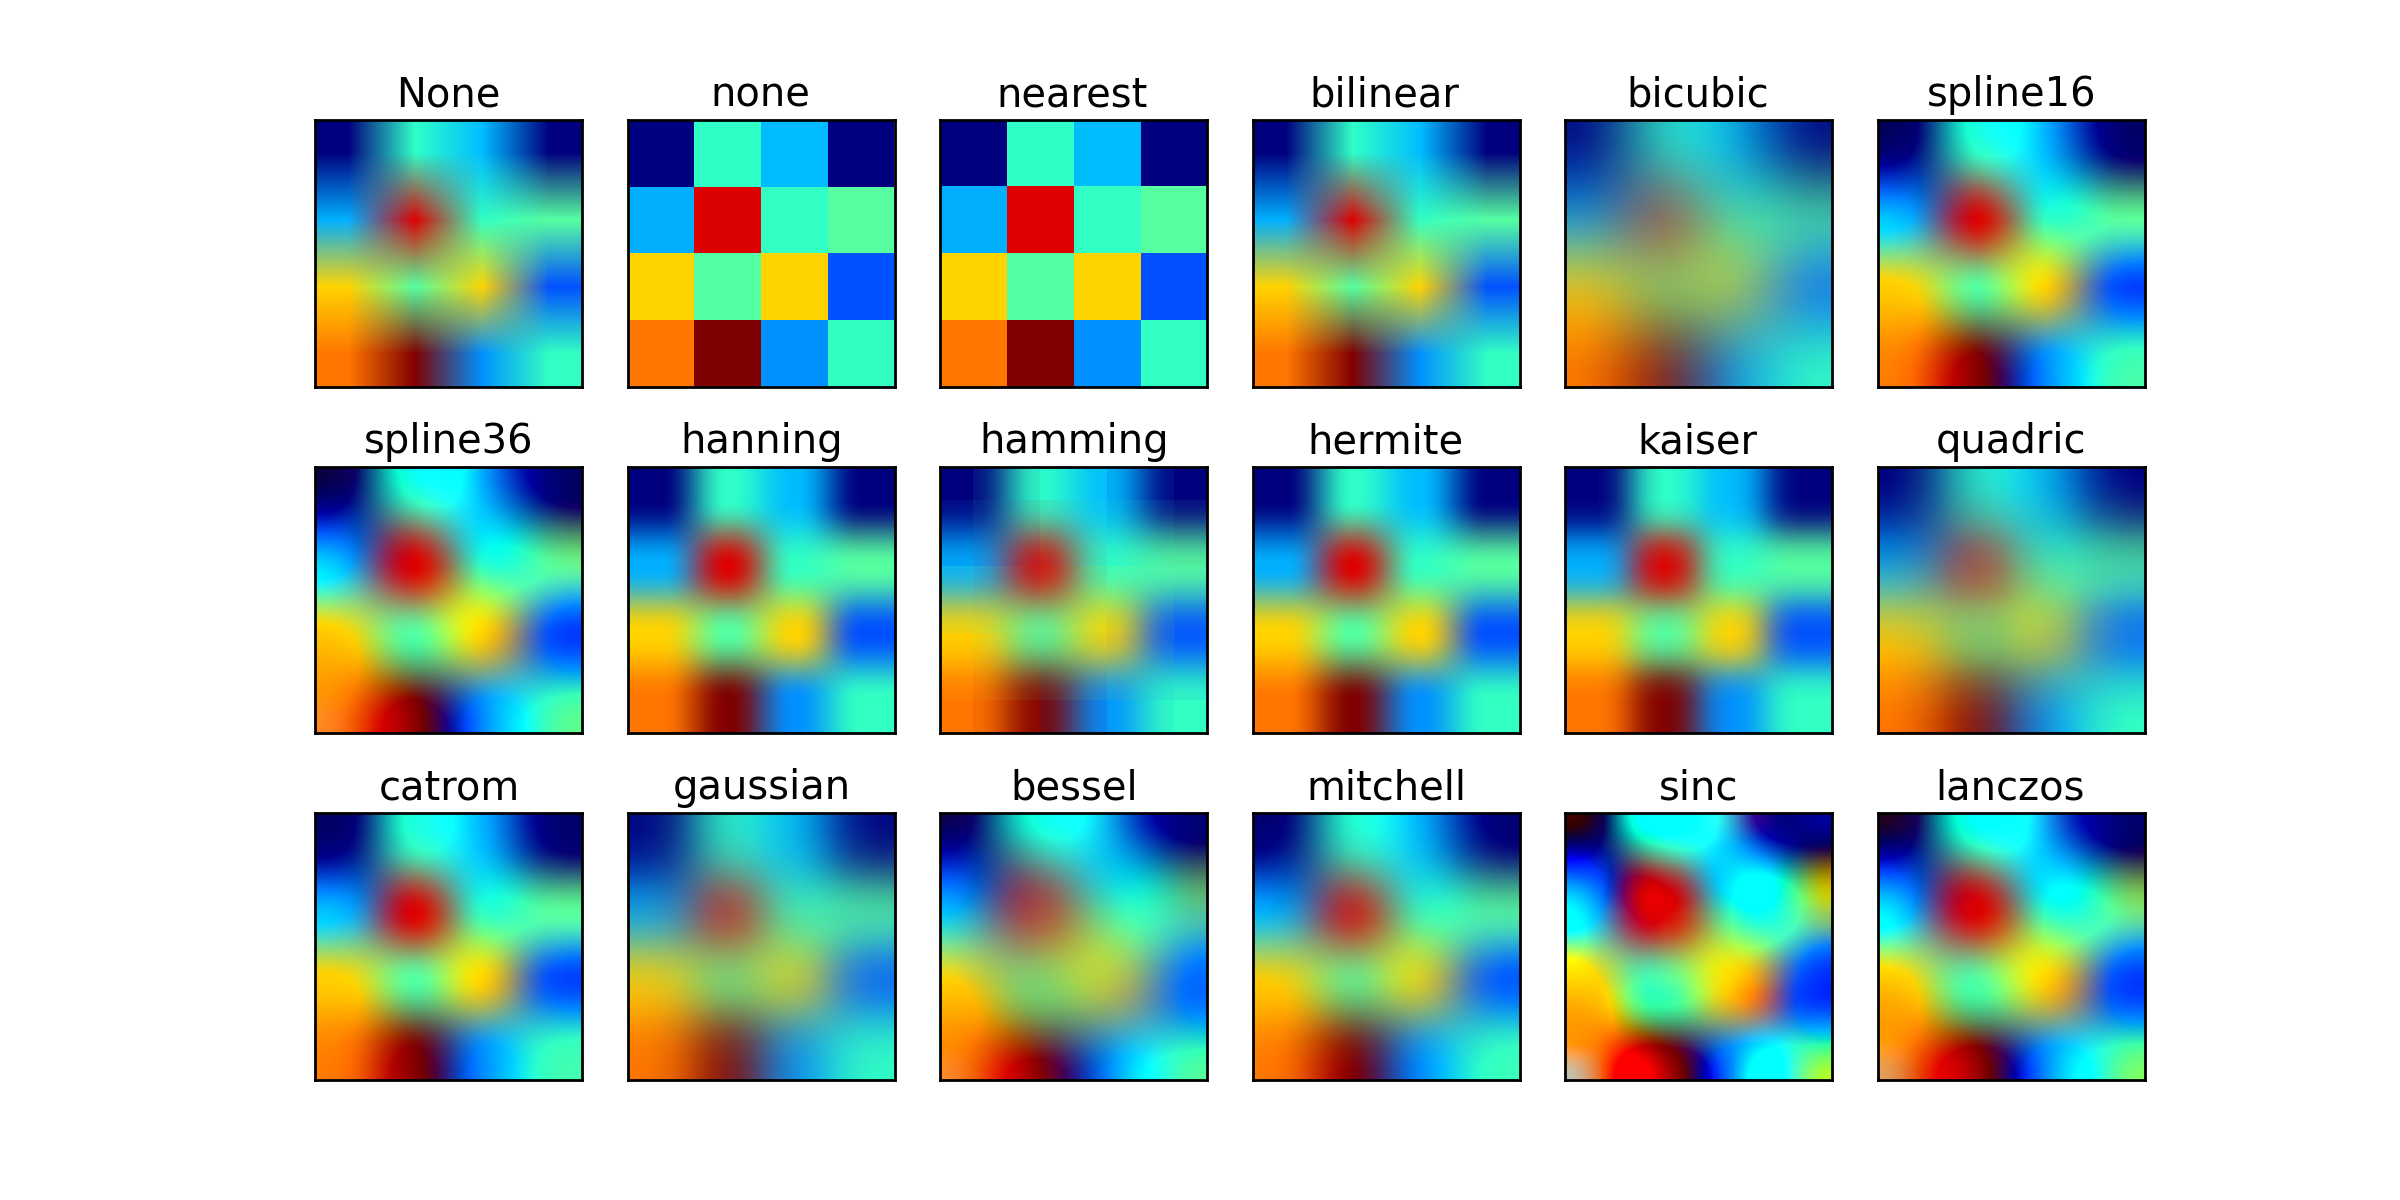
Show all different interpolation methods for imshow
'''
import matplotlib.pyplot as plt
import numpy as np
# from the docs:
# If interpolation is None, default to rc image.interpolation. See also
# the filternorm and filterrad parameters. If interpolation is 'none', then
# no interpolation is performed on the Agg, ps and pdf backends. Other
# backends will fall back to 'nearest'.
#
# http://matplotlib.org/api/pyplot_api.html#matplotlib.pyplot.imshow
methods = [None, 'none', 'nearest', 'bilinear', 'bicubic', 'spline16',
'spline36', 'hanning', 'hamming', 'hermite', 'kaiser', 'quadric',
'catrom', 'gaussian', 'bessel', 'mitchell', 'sinc', 'lanczos']
grid = np.random.rand(4, 4)
fig, axes = plt.subplots(3, 6, figsize=(12, 6),
subplot_kw={'xticks': [], 'yticks': []})
fig.subplots_adjust(hspace=0.3, wspace=0.05)
for ax, interp_method in zip(axes.flat, methods):
ax.imshow(grid, interpolation=interp_method)
ax.set_title(interp_method)
plt.show()
Keywords: python, matplotlib, pylab, example, codex (see Search examples)