Learn what to expect in the new updates

from mpl_toolkits.axes_grid1 import make_axes_locatable
from mpl_toolkits.axes_grid1.axes_divider import make_axes_area_auto_adjustable
if __name__ == "__main__":
import matplotlib.pyplot as plt
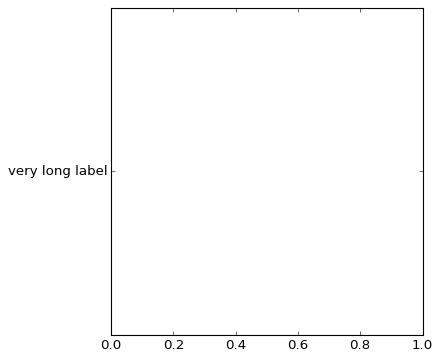
def ex1():
plt.figure(1)
ax = plt.axes([0,0,1,1])
# ax = plt.subplot(111)
ax.set_yticks([0.5])
ax.set_yticklabels(["very long label"])
make_axes_area_auto_adjustable(ax)
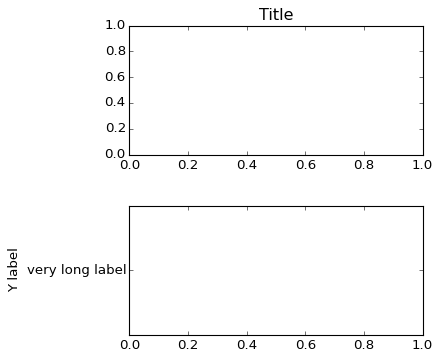
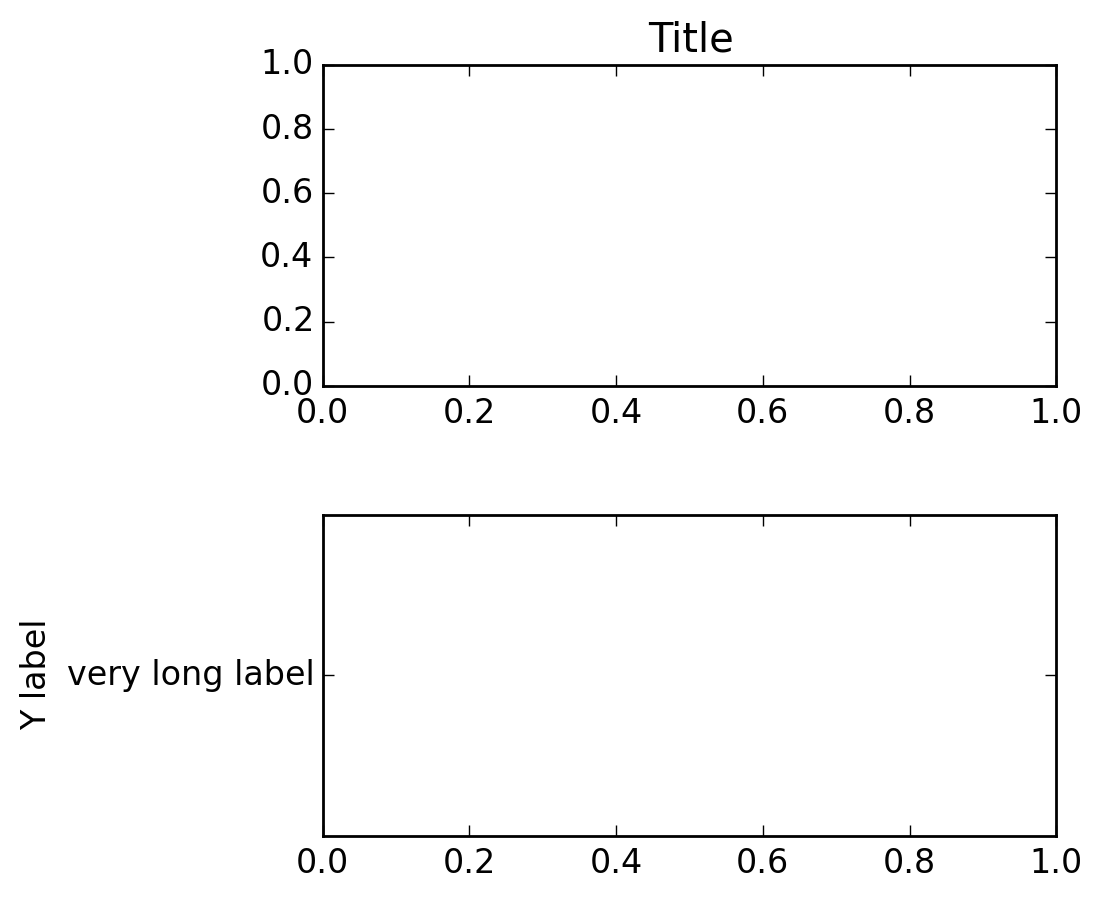
def ex2():
plt.figure(2)
ax1 = plt.axes([0,0,1,0.5])
ax2 = plt.axes([0,0.5,1,0.5])
ax1.set_yticks([0.5])
ax1.set_yticklabels(["very long label"])
ax1.set_ylabel("Y label")
ax2.set_title("Title")
make_axes_area_auto_adjustable(ax1, pad=0.1, use_axes=[ax1, ax2])
make_axes_area_auto_adjustable(ax2, pad=0.1, use_axes=[ax1, ax2])
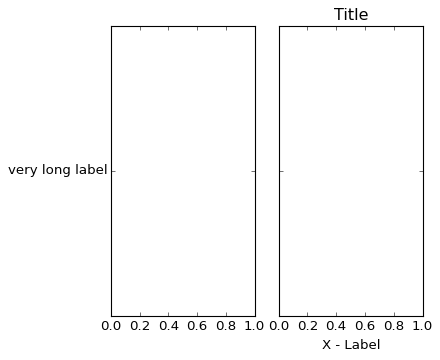
def ex3():
fig = plt.figure(3)
ax1 = plt.axes([0,0,1,1])
divider = make_axes_locatable(ax1)
ax2 = divider.new_horizontal("100%", pad=0.3, sharey=ax1)
ax2.tick_params(labelleft="off")
fig.add_axes(ax2)
divider.add_auto_adjustable_area(use_axes=[ax1], pad=0.1,
adjust_dirs=["left"])
divider.add_auto_adjustable_area(use_axes=[ax2], pad=0.1,
adjust_dirs=["right"])
divider.add_auto_adjustable_area(use_axes=[ax1, ax2], pad=0.1,
adjust_dirs=["top", "bottom"])
ax1.set_yticks([0.5])
ax1.set_yticklabels(["very long label"])
ax2.set_title("Title")
ax2.set_xlabel("X - Label")
ex1()
ex2()
ex3()
plt.show()
Keywords: python, matplotlib, pylab, example, codex (see Search examples)

