
(Source code, png, hires.png, pdf)
import numpy as np
import matplotlib.pyplot as plt
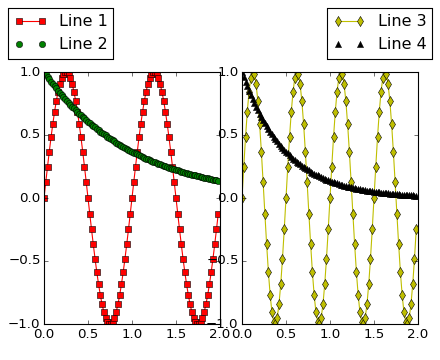
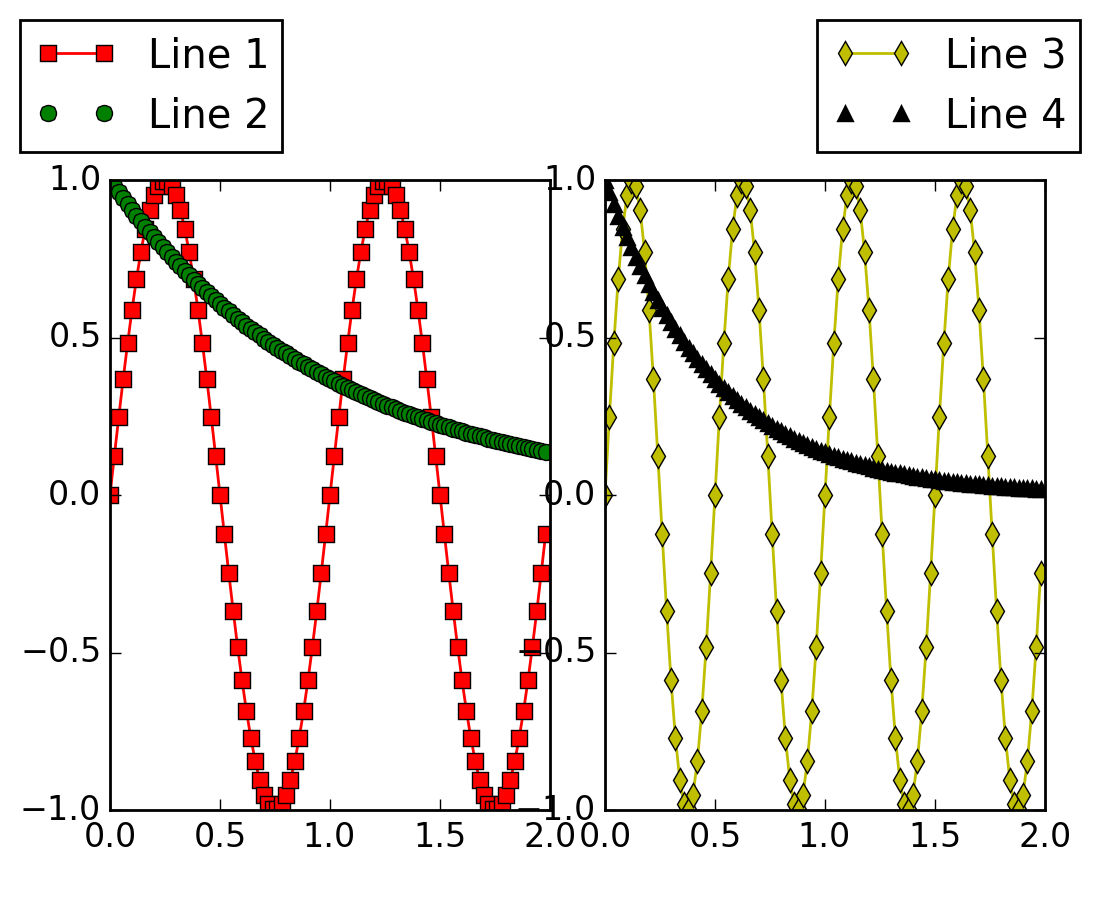
fig = plt.figure()
ax1 = fig.add_axes([0.1, 0.1, 0.4, 0.7])
ax2 = fig.add_axes([0.55, 0.1, 0.4, 0.7])
x = np.arange(0.0, 2.0, 0.02)
y1 = np.sin(2*np.pi*x)
y2 = np.exp(-x)
l1, l2 = ax1.plot(x, y1, 'rs-', x, y2, 'go')
y3 = np.sin(4*np.pi*x)
y4 = np.exp(-2*x)
l3, l4 = ax2.plot(x, y3, 'yd-', x, y4, 'k^')
fig.legend((l1, l2), ('Line 1', 'Line 2'), 'upper left')
fig.legend((l3, l4), ('Line 3', 'Line 4'), 'upper right')
plt.show()
Keywords: python, matplotlib, pylab, example, codex (see Search examples)