
(Source code, png, hires.png, pdf)
import matplotlib.pyplot as plt
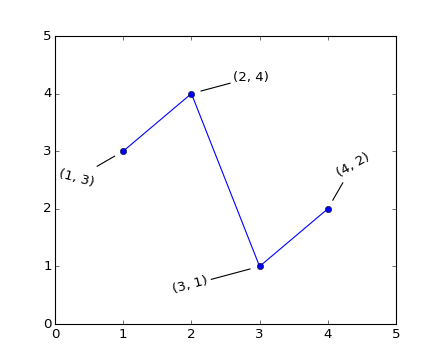
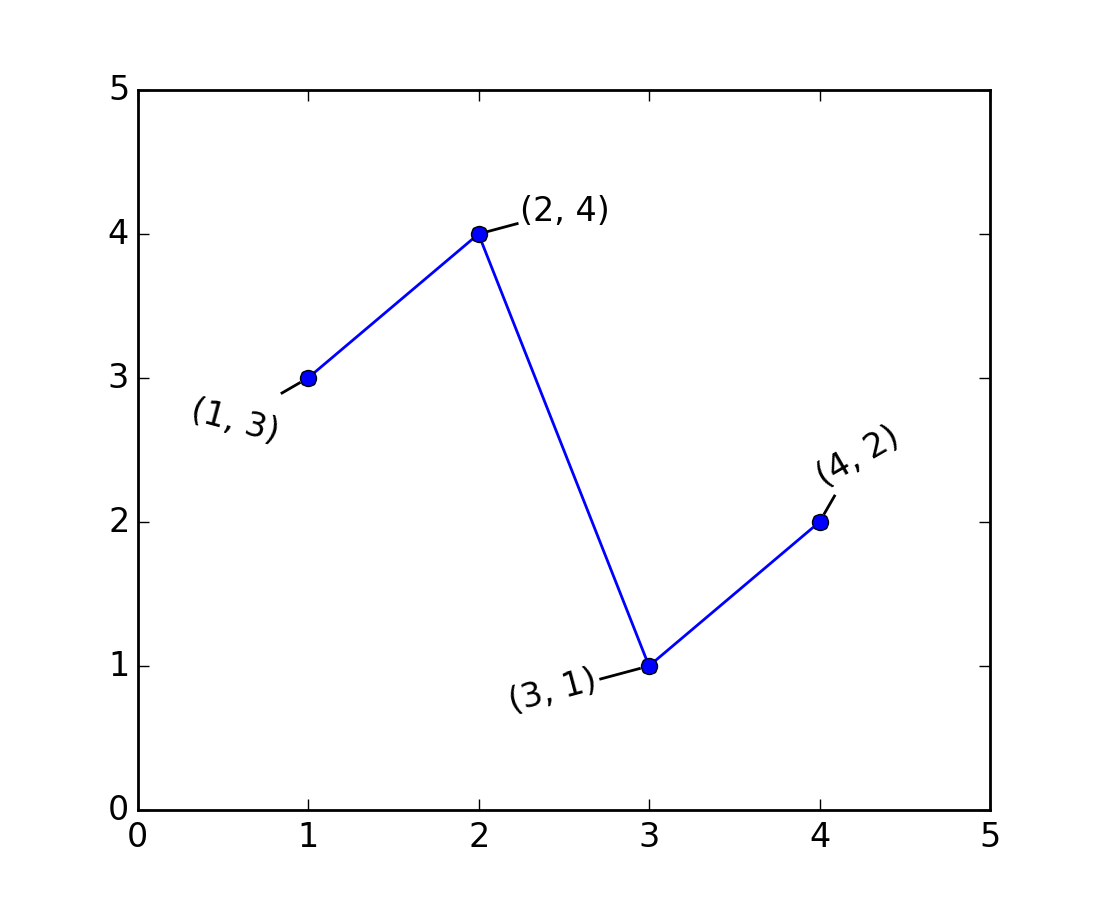
DATA = ((1, 3),
(2, 4),
(3, 1),
(4, 2))
# dash_style =
# direction, length, (text)rotation, dashrotation, push
# (The parameters are varied to show their effects,
# not for visual appeal).
dash_style = (
(0, 20, -15, 30, 10),
(1, 30, 0, 15, 10),
(0, 40, 15, 15, 10),
(1, 20, 30, 60, 10),
)
fig, ax = plt.subplots()
(x,y) = zip(*DATA)
ax.plot(x, y, marker='o')
for i in range(len(DATA)):
(x,y) = DATA[i]
(dd, dl, r, dr, dp) = dash_style[i]
#print 'dashlen call', dl
t = ax.text(x, y, str((x,y)), withdash=True,
dashdirection=dd,
dashlength=dl,
rotation=r,
dashrotation=dr,
dashpush=dp,
)
ax.set_xlim((0.0, 5.0))
ax.set_ylim((0.0, 5.0))
plt.show()
Keywords: python, matplotlib, pylab, example, codex (see Search examples)