
(Source code, png, hires.png, pdf)
from __future__ import print_function
"""
A very simple 'animation' of a 3D plot
"""
from mpl_toolkits.mplot3d import axes3d
import matplotlib.pyplot as plt
import numpy as np
import time
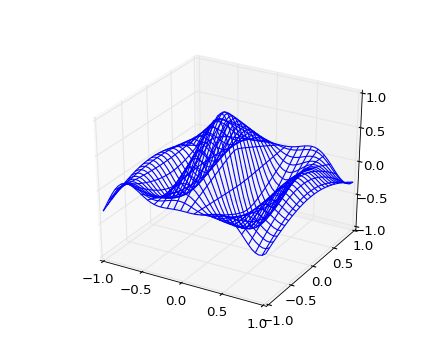
def generate(X, Y, phi):
R = 1 - np.sqrt(X**2 + Y**2)
return np.cos(2 * np.pi * X + phi) * R
plt.ion()
fig = plt.figure()
ax = fig.add_subplot(111, projection='3d')
xs = np.linspace(-1, 1, 50)
ys = np.linspace(-1, 1, 50)
X, Y = np.meshgrid(xs, ys)
Z = generate(X, Y, 0.0)
wframe = None
tstart = time.time()
for phi in np.linspace(0, 360 / 2 / np.pi, 100):
oldcol = wframe
Z = generate(X, Y, phi)
wframe = ax.plot_wireframe(X, Y, Z, rstride=2, cstride=2)
# Remove old line collection before drawing
if oldcol is not None:
ax.collections.remove(oldcol)
plt.pause(.001)
print ('FPS: %f' % (100 / (time.time() - tstart)))
Keywords: python, matplotlib, pylab, example, codex (see Search examples)