
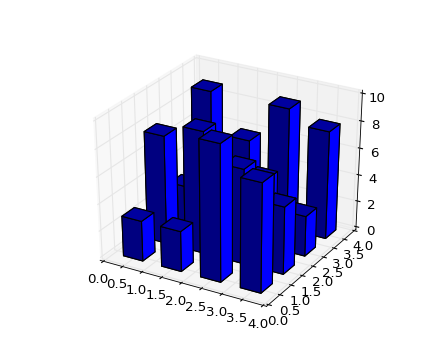
(Source code, png, hires.png, pdf)

from mpl_toolkits.mplot3d import Axes3D
import matplotlib.pyplot as plt
import numpy as np
fig = plt.figure()
ax = fig.add_subplot(111, projection='3d')
x, y = np.random.rand(2, 100) * 4
hist, xedges, yedges = np.histogram2d(x, y, bins=4)
elements = (len(xedges) - 1) * (len(yedges) - 1)
xpos, ypos = np.meshgrid(xedges[:-1]+0.25, yedges[:-1]+0.25)
xpos = xpos.flatten()
ypos = ypos.flatten()
zpos = np.zeros(elements)
dx = 0.5 * np.ones_like(zpos)
dy = dx.copy()
dz = hist.flatten()
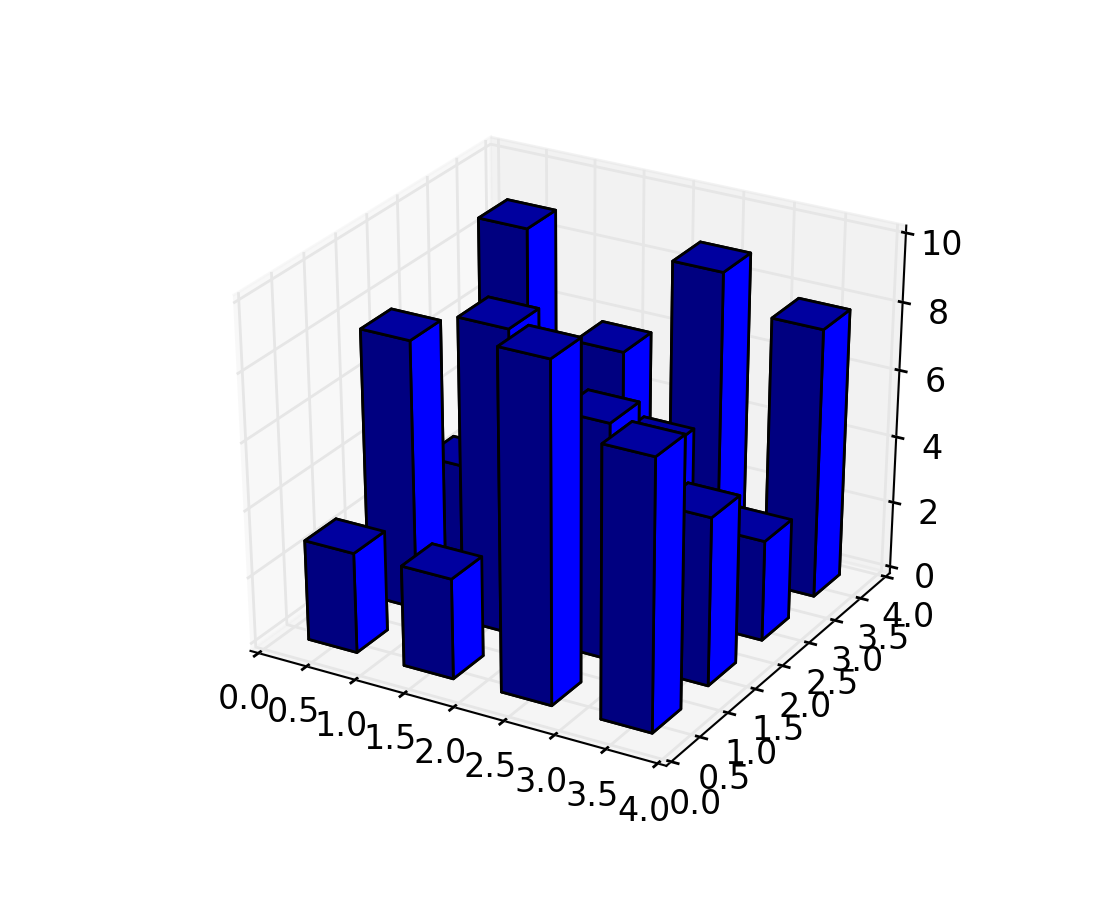
ax.bar3d(xpos, ypos, zpos, dx, dy, dz, color='b', zsort='average')
plt.show()
Keywords: python, matplotlib, pylab, example, codex (see Search examples)