
"""
When plotting time series, eg financial time series, one often wants
to leave out days on which there is no data, eh weekends. The example
below shows how to use an 'index formatter' to achieve the desired plot
"""
from __future__ import print_function
import numpy as np
import matplotlib.pyplot as plt
import matplotlib.mlab as mlab
import matplotlib.cbook as cbook
import matplotlib.ticker as ticker
datafile = cbook.get_sample_data('aapl.csv', asfileobj=False)
print ('loading %s' % datafile)
r = mlab.csv2rec(datafile)
r.sort()
r = r[-30:] # get the last 30 days
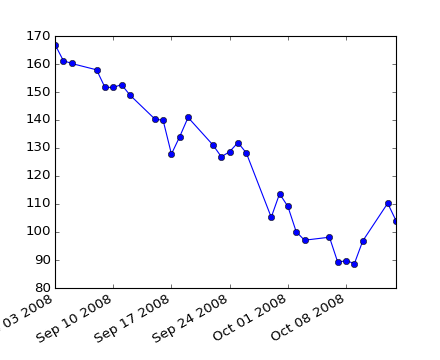
# first we'll do it the default way, with gaps on weekends
fig, ax = plt.subplots()
ax.plot(r.date, r.adj_close, 'o-')
fig.autofmt_xdate()
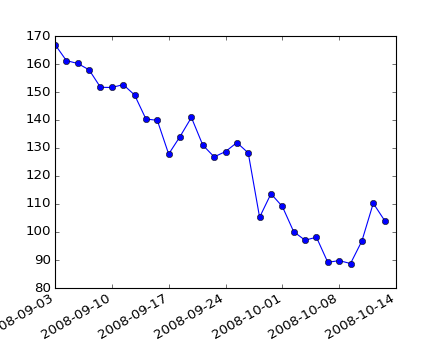
# next we'll write a custom formatter
N = len(r)
ind = np.arange(N) # the evenly spaced plot indices
def format_date(x, pos=None):
thisind = np.clip(int(x+0.5), 0, N-1)
return r.date[thisind].strftime('%Y-%m-%d')
fig, ax = plt.subplots()
ax.plot(ind, r.adj_close, 'o-')
ax.xaxis.set_major_formatter(ticker.FuncFormatter(format_date))
fig.autofmt_xdate()
plt.show()
Keywords: python, matplotlib, pylab, example, codex (see Search examples)