
#!/usr/bin/env python
# Working with multiple figure windows and subplots
from pylab import *
t = arange(0.0, 2.0, 0.01)
s1 = sin(2*pi*t)
s2 = sin(4*pi*t)
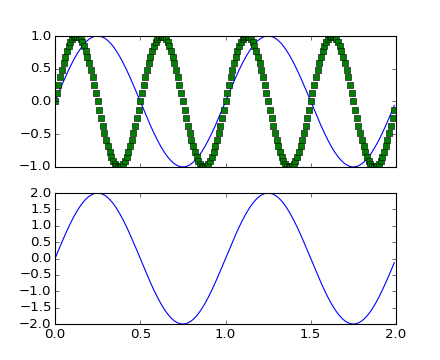
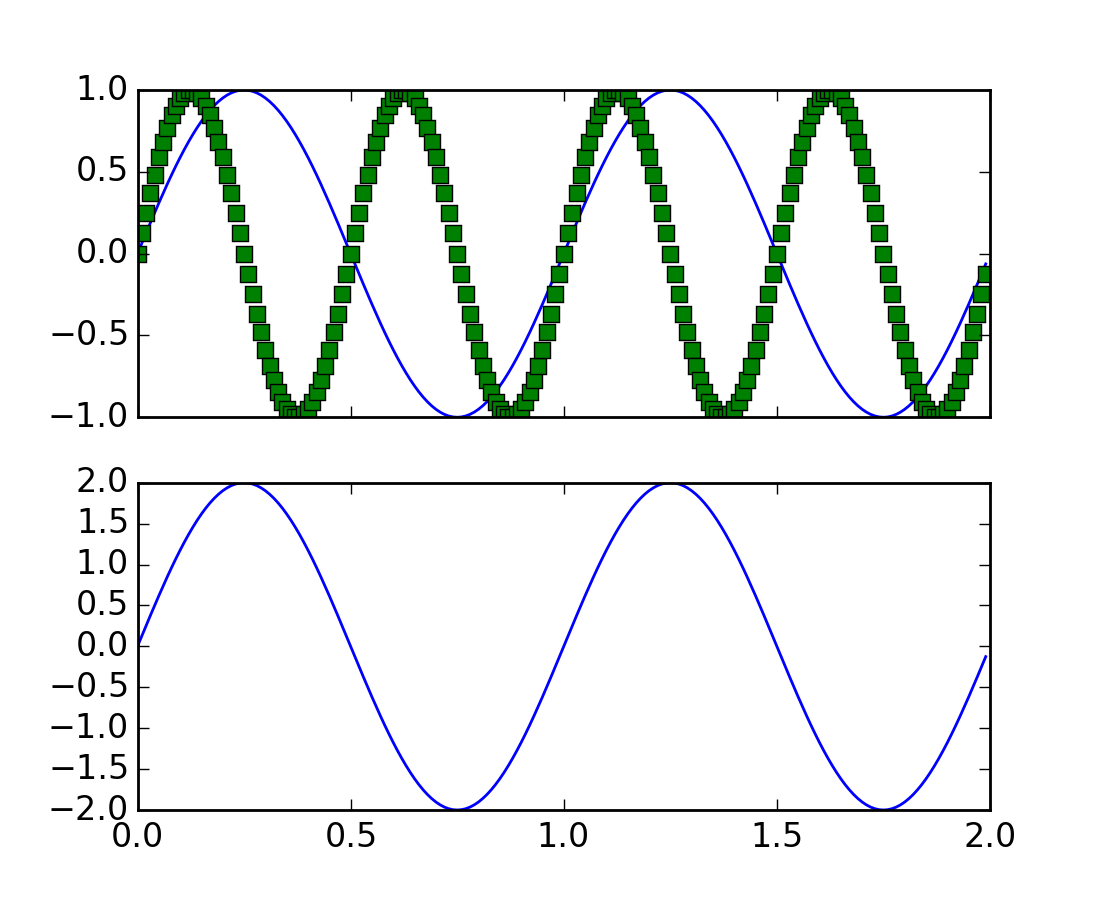
figure(1)
subplot(211)
plot(t,s1)
subplot(212)
plot(t,2*s1)
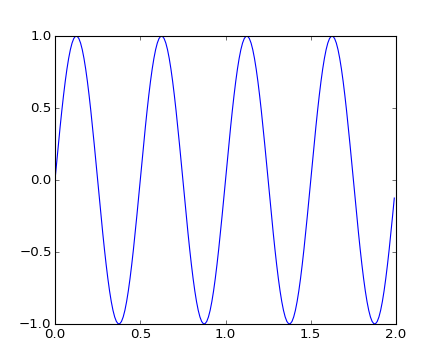
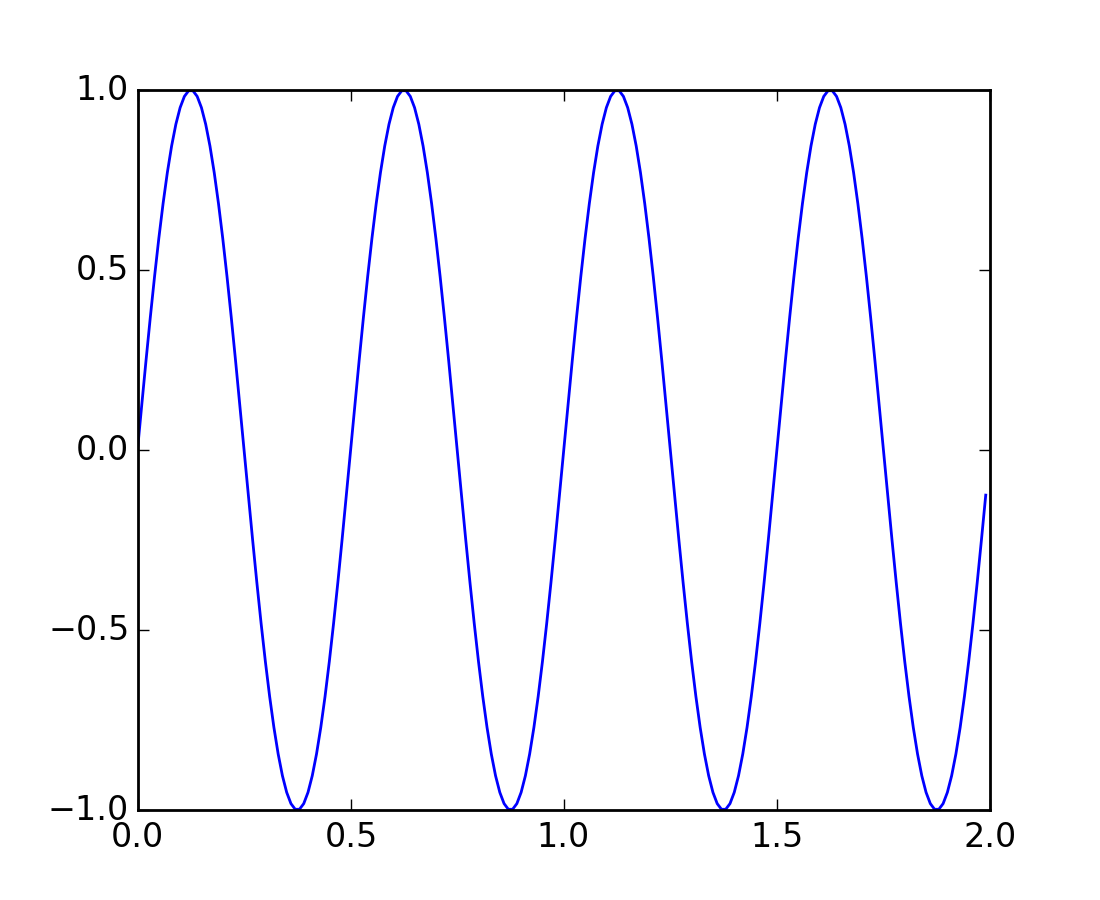
figure(2)
plot(t,s2)
# now switch back to figure 1 and make some changes
figure(1)
subplot(211)
plot(t,s2, 'gs')
setp(gca(), 'xticklabels', [])
figure(1)
savefig('fig1')
figure(2)
savefig('fig2')
show()
Keywords: python, matplotlib, pylab, example, codex (see Search examples)