
(Source code, png, hires.png, pdf)
#!/usr/bin/env python
"""
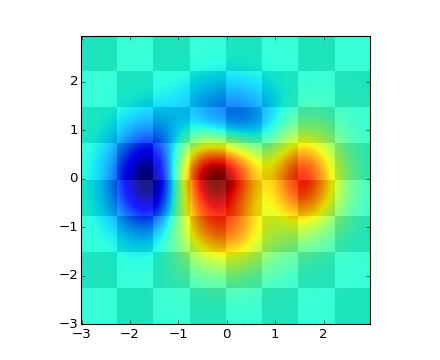
Layer images above one another using alpha blending
"""
from __future__ import division
from pylab import *
def func3(x,y):
return (1- x/2 + x**5 + y**3)*exp(-x**2-y**2)
# make these smaller to increase the resolution
dx, dy = 0.05, 0.05
x = arange(-3.0, 3.0, dx)
y = arange(-3.0, 3.0, dy)
X,Y = meshgrid(x, y)
# when layering multiple images, the images need to have the same
# extent. This does not mean they need to have the same shape, but
# they both need to render to the same coordinate system determined by
# xmin, xmax, ymin, ymax. Note if you use different interpolations
# for the images their apparent extent could be different due to
# interpolation edge effects
xmin, xmax, ymin, ymax = amin(x), amax(x), amin(y), amax(y)
extent = xmin, xmax, ymin, ymax
fig = plt.figure(frameon=False)
Z1 = array(([0,1]*4 + [1,0]*4)*4); Z1.shape = 8,8 # chessboard
im1 = imshow(Z1, cmap=cm.gray, interpolation='nearest',
extent=extent)
hold(True)
Z2 = func3(X, Y)
im2 = imshow(Z2, cmap=cm.jet, alpha=.9, interpolation='bilinear',
extent=extent)
#axis([xmin, xmax, ymin, ymax])
show()
Keywords: python, matplotlib, pylab, example, codex (see Search examples)