
(Source code, png, hires.png, pdf)

#!/usr/bin/env python
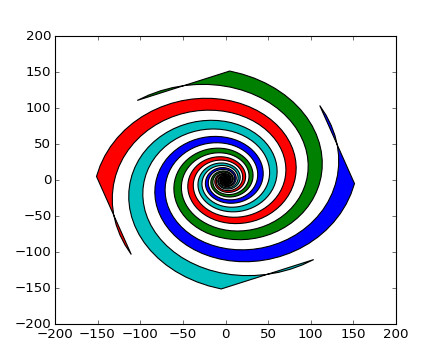
from pylab import *
theta = arange(0,8*pi,0.1)
a=1
b=.2
for dt in arange(0,2*pi,pi/2.0):
x = a*cos( theta+dt )*exp(b*theta)
y = a*sin( theta+dt )*exp(b*theta)
dt = dt+pi/4.0
x2 = a*cos( theta+dt )*exp(b*theta)
y2 = a*sin( theta+dt )*exp(b*theta)
xf = concatenate( (x,x2[::-1]) )
yf = concatenate( (y,y2[::-1]) )
p1=fill(xf,yf)
show()
Keywords: python, matplotlib, pylab, example, codex (see Search examples)